 | | | Switch to: Europe, USA, New Zealand, Antarctica Credit: NOAA/Ovation  Planetary K-index Planetary K-index
Now: Kp= 1 quiet
24-hr max: Kp= 2 quiet
explanation | more data
Interplanetary Mag. Field
Btotal: 2.8 nT
Bz: -0.1 nT south
more data: ACE, DSCOVR
Updated: Today at 2346 UT Coronal Holes: 26 Jan 20 
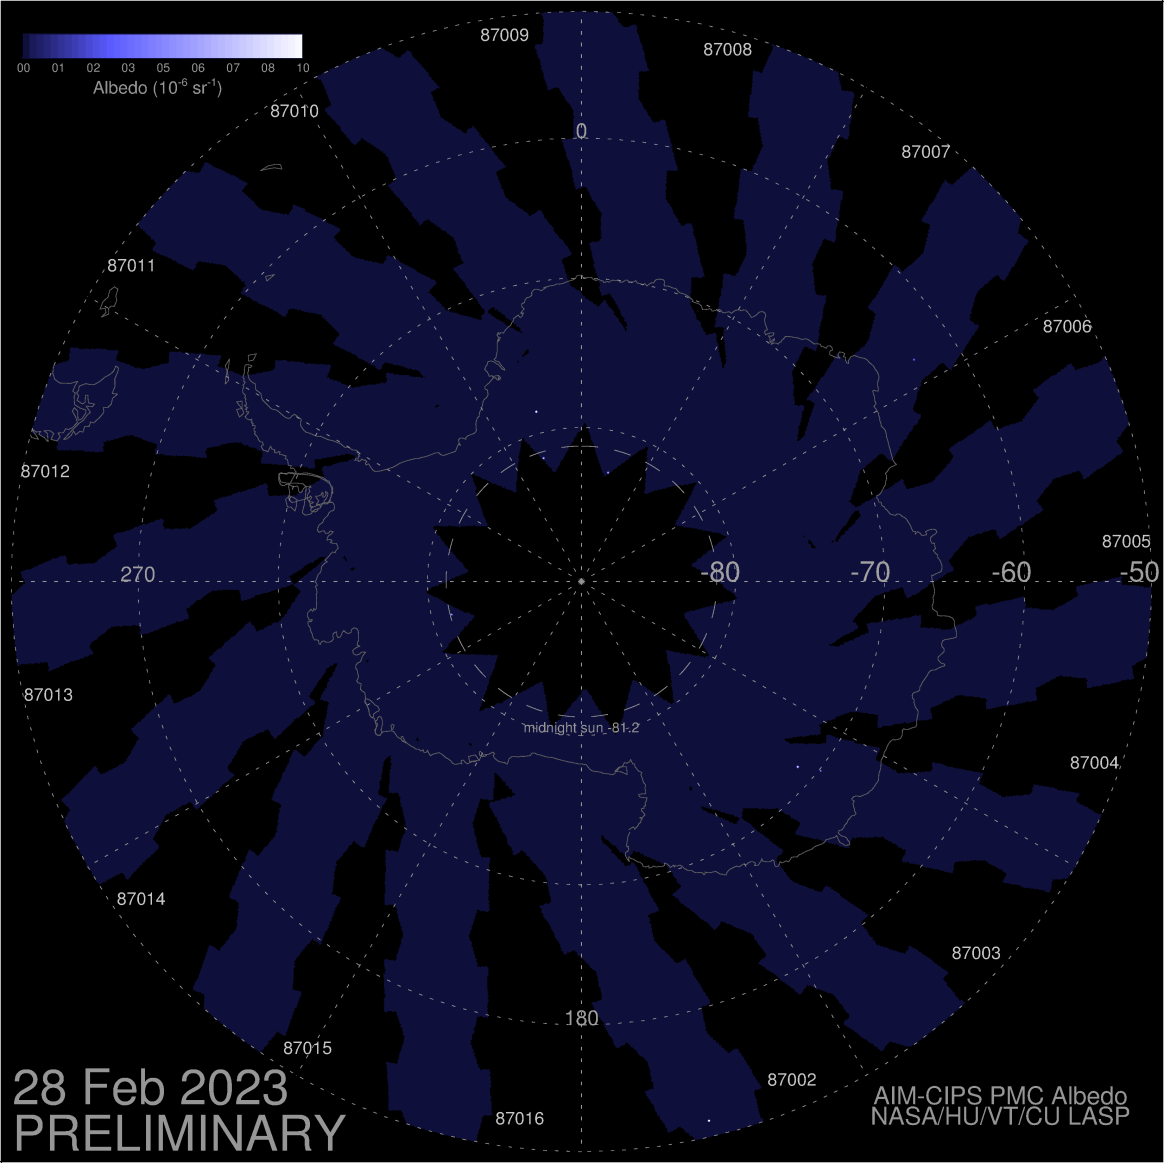
Solar wind flowing from this coronal hole could brush Earth's magnetic field on Jan. 31-Feb. 1.. Credit: SDO/AIA  Noctilucent Clouds The southern hemisphere season for noctilucent clouds began on Nov. 15th--the earliest start in recorded history. Check here for daily images from NASA's AIM spacecraft. Switch view: Europe, USA, Asia, Polar Updated at: 01-26-2020 18:55:03 UT Noctilucent Clouds The southern hemisphere season for noctilucent clouds began on Nov. 15th--the earliest start in recorded history. Check here for daily images from NASA's AIM spacecraft. Switch view: Europe, USA, Asia, Polar Updated at: 01-26-2020 18:55:03 UT SPACE WEATHER
NOAA Forecasts | | Updated at: 2020 Jan 18 2200 UTC FLARE | 0-24 hr | 24-48 hr | CLASS M | 01 % | 01 % | CLASS X | 01 % | 01 % | Geomagnetic Storms:
Probabilities for significant disturbances in Earth's magnetic field are given for three activity levels: active, minor storm, severe storm Updated at: 2020 Jan 18 2200 UTC Mid-latitudes | 0-24 hr | 24-48 hr | ACTIVE | 20 % | 25 % | MINOR | 05 % | 10 % | SEVERE | 01 % | 01 % | High latitudes | 0-24 hr | 24-48 hr | ACTIVE | 15 % | 15 % | MINOR | 25 % | 30 % | SEVERE | 30 % | 40 % | | | |  | | | | | | | | | | | Solar minimum is here - but even now strangely beautiful auroras are dancing around the poles. Deep inside the Arctic Circle, the expert guides of Aurora Holidays in Utsjoki, Finland, can help you chase them. Book now! | | | TWO SOLAR CYCLES ACTIVE AT ONCE: Today, there are two active regions on the surface of the sun, places where strong magnetic fields are bubbling up from below. The magnetic polarity of the regions reveals something interesting: Two solar cycles are active at once. One region belongs to old Solar Cycle 24, the other to new Solar Cycle 25. This is normal. Solar cycles always overlap at their boundaries. It's just the latest sign that change is occurring on the sun. Aurora alerts: SMS Text. POLAR STRATOSPHERIC CLOUDS, THE GOOD AND THE BAD: This week, Arctic sky watchers have marveled at the latest outbreak of polar stratospheric clouds (PSCs). Some observers call them "daytime auroras" because the clouds' colors rival Northern Lights. It's wonderful--except when it's not. PSCs come in two varieties, the good and the bad, both captured in this Jan. 25th photo taken by Rauno Pakarinen of Pieksämäki, Finland: 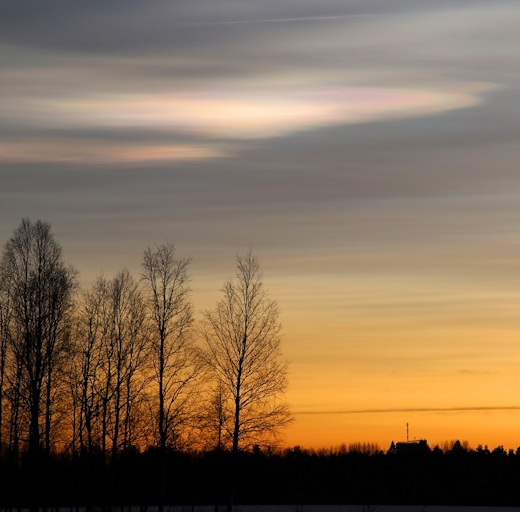
The good PSCs are on top, made of harmless water ice, glowing with the striking iridescent colors that have led onlookers to compare them to auroras. The bad PSCs are on the bottom, a sinister-looking yellow haze. "Bad PSCs", also known as Type I polar stratospheric clouds, are made from tiny droplets of nitric acid, sulfuric acid, and other compounds. The surfaces of these droplets act as catalysts, converting relatively benign forms of man-made chlorine into active free radicals, which can destroy ozone. Bad PSCs make ozone holes, passing harmful UV radiation to the surface of the Earth below. PSCs, when they do appear, are normally confined to the far north. "Pieksämäki is WAY south of the Lappland, so this is a very rare sighting indeed!!!" says Pakarinen. Realtime Spaceweather Photo Gallery
Free: Spaceweather.com Newsletter STARLINK SATELLITES: SpaceX has an idea: Surround the Earth with 42,000 satellites and provide broadband internet to every corner of the globe. The project is called Starlink--and it could destroy the night sky. Starlink satellites are quite bright. En masse, they have the potential to seriously interfere with research-grade astrophotography. Ulrich C. Beinert was flying in an airplane over the Canada-USA border on Jan. 20th when he got an eyeful: 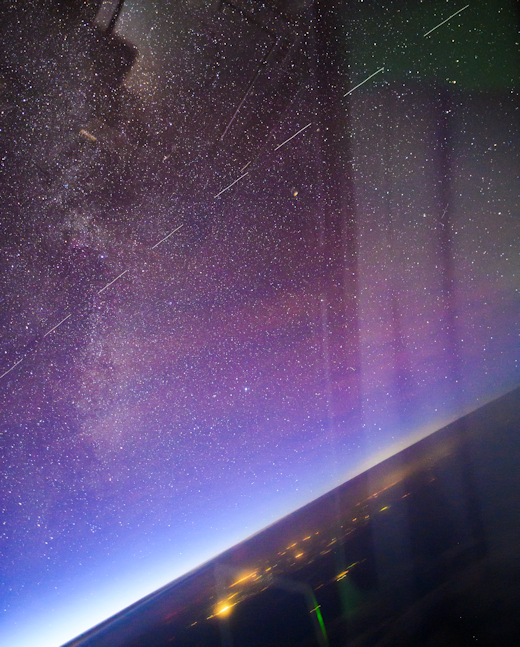
"From the cockpit of an Airbus A380, I witnessed a train of Starlink satellites pass in their eerie formation," says Beinert. "Quick to grab my camera, I caught this shot with eight of the satellites, then watched as dozens more flew past us in the evening sky."
At the moment only ~180 Starlink satellites orbit Earth, yet they are frequently sighted. Now imagine 42,000. Astronomers could have trouble photographing anything without a Starlink satellite passing through the field of view.
Starlink launches will intensify in 2020, with ~1000 more satellites expected by the end of the year. For the most recent launch on Jan. 6th, SpaceX applied an experimental coating to one of the satellites to dim its brightness. However, preliminary observations by some observers suggest the coating makes little difference. Keep trying, SpaceX! Realtime Spaceweather Photo Gallery
Free: Spaceweather.com Newsletter INFINITY PENDANT FOR VALENTINE'S DAY: Valentine's Day is less than one month away. Nothing says "I Love You" like an Infinity Pendant from the edge of space. On Jan. 8, 2020, the students of Earth to Sky Calculus launched a cosmic ray balloon. This authentic Swarovski crystal pendant hitched a ride, traveling 113,209 feet above the Sierra Nevada mountains of central California: 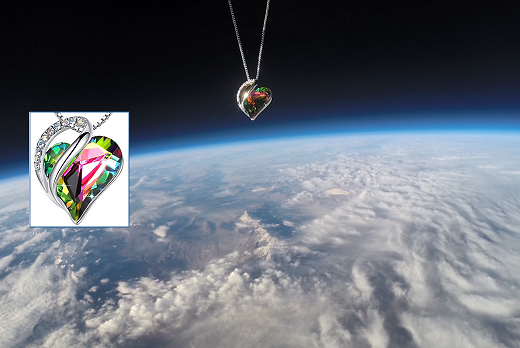
You can have it for $179.95. The students are selling these pendants to support their cosmic ray ballooning program. The glittering heart-shaped crystal is wrapped in a silver-embossed infinity clasp, symbolizing unending love. Each one comes with a romantic card showing the pendant in flight and telling the story of its journey to the edge of space and back again. Far Out Gifts: Earth to Sky Store
All sales support hands-on STEM education Realtime Aurora Photo Gallery
Free: Spaceweather.com Newsletter
Every night, a network of NASA all-sky cameras scans the skies above the United States for meteoritic fireballs. Automated software maintained by NASA's Meteoroid Environment Office calculates their orbits, velocity, penetration depth in Earth's atmosphere and many other characteristics. Daily results are presented here on Spaceweather.com. On Jan. 26, 2020, the network reported 14 fireballs.
(14 sporadics)  In this diagram of the inner solar system, all of the fireball orbits intersect at a single point--Earth. The orbits are color-coded by velocity, from slow (red) to fast (blue). [Larger image] [movies] Potentially Hazardous Asteroids ( PHAs) are space rocks larger than approximately 100m that can come closer to Earth than 0.05 AU. None of the known PHAs is on a collision course with our planet, although astronomers are finding new ones all the time. On January 26, 2020 there were 2018 potentially hazardous asteroids.
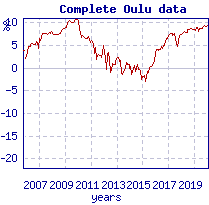
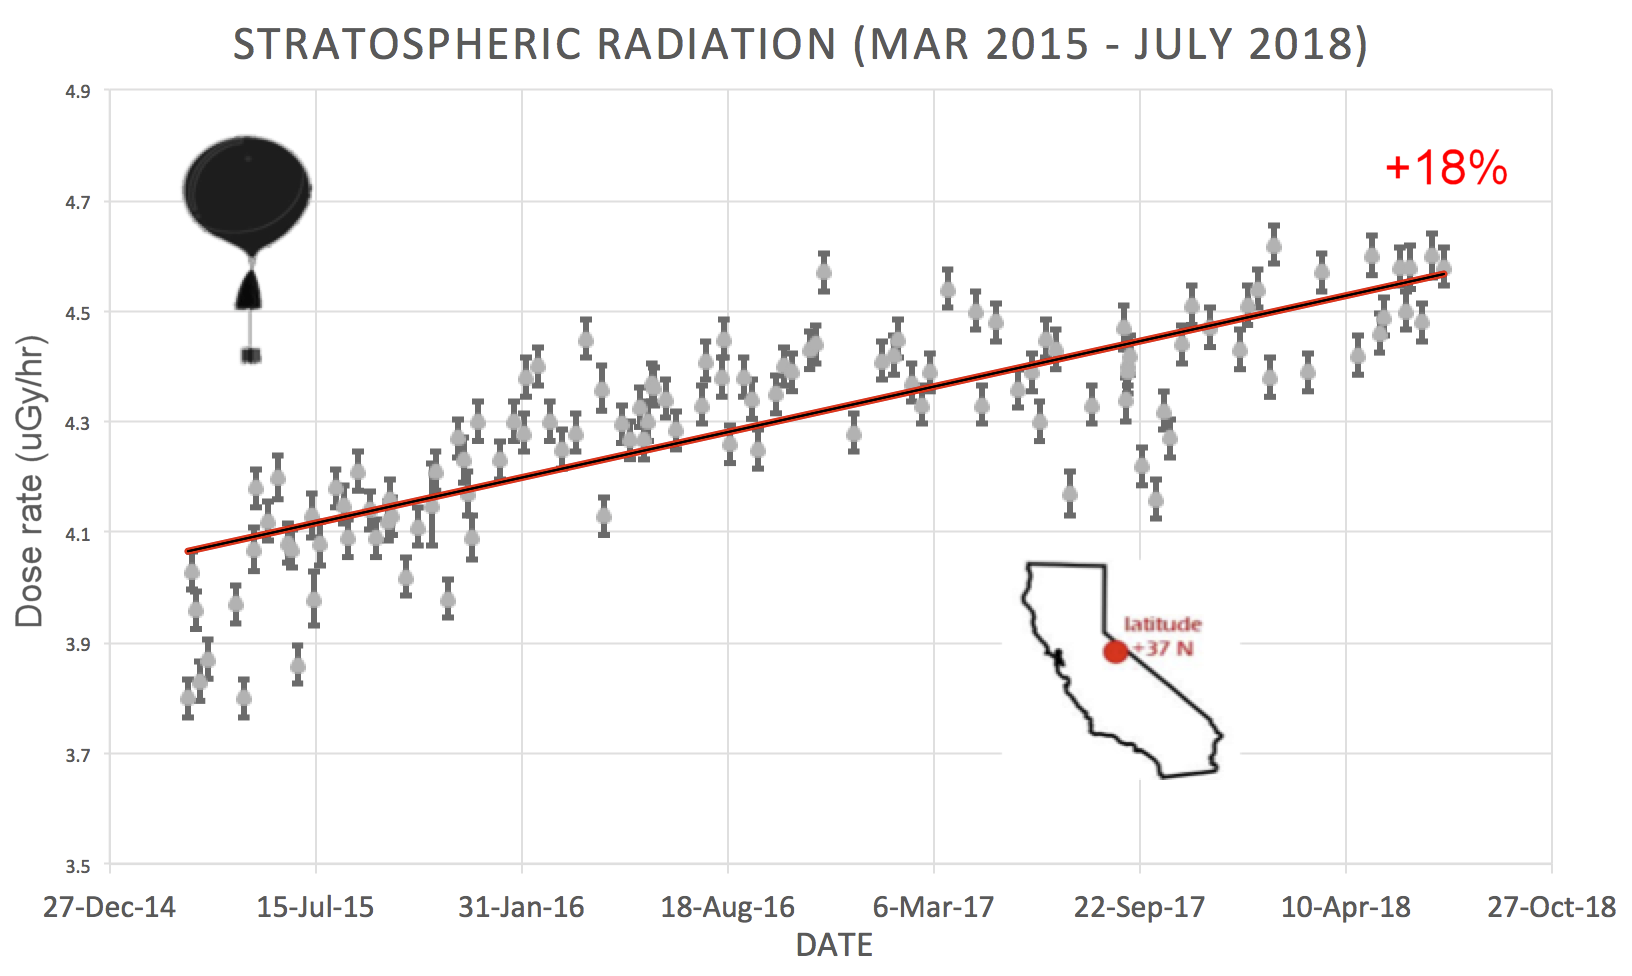
 | Recent & Upcoming Earth-asteroid encounters: | Asteroid | Date(UT) | Miss Distance | Velocity (km/s) | Diameter (m) | | 2020 BQ2 | 2020-Jan-21 | 19.1 LD | 8.7 | 31 | | 2020 BP1 | 2020-Jan-21 | 13.9 LD | 5.2 | 13 | | 2020 BS1 | 2020-Jan-21 | 6.6 LD | 5.5 | 20 | | 2020 BP | 2020-Jan-21 | 3.7 LD | 16.7 | 27 | | 2020 BB | 2020-Jan-21 | 2 LD | 3.7 | 7 | | 2020 BY | 2020-Jan-21 | 3.8 LD | 16.7 | 46 | | 2020 BN | 2020-Jan-21 | 9.8 LD | 6.1 | 10 | | 2020 BB5 | 2020-Jan-22 | 0.7 LD | 9 | 4 | | 2020 BP8 | 2020-Jan-22 | 17.7 LD | 16.5 | 29 | | 2020 BU | 2020-Jan-22 | 19.3 LD | 4.2 | 23 | | 2020 BF6 | 2020-Jan-22 | 7.3 LD | 8.7 | 30 | | 2019 TF2 | 2020-Jan-23 | 16.2 LD | 1.6 | 19 | | 2020 BB1 | 2020-Jan-23 | 2.6 LD | 11.4 | 8 | | 2020 BH7 | 2020-Jan-23 | 12.3 LD | 7.8 | 10 | | 2018 BM5 | 2020-Jan-23 | 13.1 LD | 8.6 | 12 | | 2020 BF1 | 2020-Jan-24 | 7.8 LD | 4.6 | 21 | | 2020 BG6 | 2020-Jan-24 | 14.8 LD | 8.3 | 42 | | 2020 BH6 | 2020-Jan-25 | 0.2 LD | 10.2 | 7 | | 2020 AK3 | 2020-Jan-25 | 8.3 LD | 6.9 | 21 | | 2020 BK8 | 2020-Jan-25 | 7.9 LD | 7.7 | 7 | | 2020 BH3 | 2020-Jan-26 | 5.1 LD | 6.8 | 22 | | 2020 BE8 | 2020-Jan-26 | 11.2 LD | 4.6 | 32 | | 2020 BY5 | 2020-Jan-26 | 11.9 LD | 7.8 | 18 | | 2020 BN3 | 2020-Jan-27 | 6.9 LD | 28.9 | 30 | | 2020 BY4 | 2020-Jan-27 | 6.9 LD | 21.2 | 21 | | 2020 BO2 | 2020-Jan-28 | 10.5 LD | 10.7 | 19 | | 2020 BJ7 | 2020-Jan-28 | 1.2 LD | 20.2 | 8 | | 2020 BJ1 | 2020-Jan-29 | 15.5 LD | 11 | 51 | | 2018 AL12 | 2020-Jan-30 | 18.2 LD | 17.7 | 39 | | 2020 BV7 | 2020-Jan-30 | 5.9 LD | 8.3 | 9 | | 2020 BR8 | 2020-Jan-31 | 9.7 LD | 29.4 | 27 | | 2020 BZ4 | 2020-Jan-31 | 5.7 LD | 9 | 10 | | 2017 AE5 | 2020-Feb-01 | 13.6 LD | 9 | 123 | | 2013 BA74 | 2020-Feb-04 | 3.7 LD | 7.4 | 28 | | 2020 BL8 | 2020-Feb-08 | 6.6 LD | 3.2 | 29 | | 2020 BW5 | 2020-Feb-09 | 5.2 LD | 9 | 18 | | 163373 | 2020-Feb-15 | 15.1 LD | 15.2 | 589 | | 2018 CW2 | 2020-Feb-17 | 6 LD | 10.2 | 28 | | 2020 BL7 | 2020-Feb-19 | 13.6 LD | 8.7 | 35 | | 2020 BC9 | 2020-Feb-20 | 14 LD | 9.4 | 73 | | 2019 BE5 | 2020-Feb-20 | 13.9 LD | 14.8 | 34 | | 2011 DR | 2020-Feb-23 | 14.7 LD | 5.8 | 25 | | 2016 CO246 | 2020-Feb-23 | 18.4 LD | 5.9 | 25 | | 2012 DS30 | 2020-Feb-26 | 12.3 LD | 5.4 | 22 | | 2015 BK509 | 2020-Feb-29 | 18.7 LD | 12.5 | 118 | | 2017 BM123 | 2020-Mar-01 | 10.5 LD | 8.1 | 65 | | 2018 RF6 | 2020-Mar-10 | 11.2 LD | 12.6 | 36 | | 2008 UB95 | 2020-Mar-11 | 18.5 LD | 7.6 | 41 | | 2018 GY | 2020-Mar-15 | 6.2 LD | 9.5 | 39 | Notes: LD means "Lunar Distance." 1 LD = 384,401 km, the distance between Earth and the Moon. 1 LD also equals 0.00256 AU. MAG is the visual magnitude of the asteroid on the date of closest approach. | | Cosmic Rays in the Atmosphere | SOMETHING NEW! We have developed a new predictive model of aviation radiation. It's called E-RAD--short for Empirical RADiation model. We are constantly flying radiation sensors onboard airplanes over the US and and around the world, so far collecting more than 22,000 gps-tagged radiation measurements. Using this unique dataset, we can predict the dosage on any flight over the USA with an error no worse than 15%. E-RAD lets us do something new: Every day we monitor approximately 1400 flights criss-crossing the 10 busiest routes in the continental USA. Typically, this includes more than 80,000 passengers per day. E-RAD calculates the radiation exposure for every single flight. The Hot Flights Table is a daily summary of these calculations. It shows the 5 charter flights with the highest dose rates; the 5 commercial flights with the highest dose rates; 5 commercial flights with near-average dose rates; and the 5 commercial flights with the lowest dose rates. Passengers typically experience dose rates that are 20 to 70 times higher than natural radiation at sea level. To measure radiation on airplanes, we use the same sensors we fly to the stratosphere onboard Earth to Sky Calculus cosmic ray balloons: neutron bubble chambers and X-ray/gamma-ray Geiger tubes sensitive to energies between 10 keV and 20 MeV. These energies span the range of medical X-ray machines and airport security scanners. Column definitions: (1) The flight number; (2) The maximum dose rate during the flight, expressed in units of natural radiation at sea level; (3) The maximum altitude of the plane in feet above sea level; (4) Departure city; (5) Arrival city; (6) Duration of the flight. SPACE WEATHER BALLOON DATA: Approximately once a week, Spaceweather.com and the students of Earth to Sky Calculus fly space weather balloons to the stratosphere over California. These balloons are equipped with radiation sensors that detect cosmic rays, a surprisingly "down to Earth" form of space weather. Cosmic rays can seed clouds, trigger lightning, and penetrate commercial airplanes. Furthermore, there are studies ( #1, #2, #3, #4) linking cosmic rays with cardiac arrhythmias and sudden cardiac death in the general population. Our latest measurements show that cosmic rays are intensifying, with an increase of more than 18% since 2015: 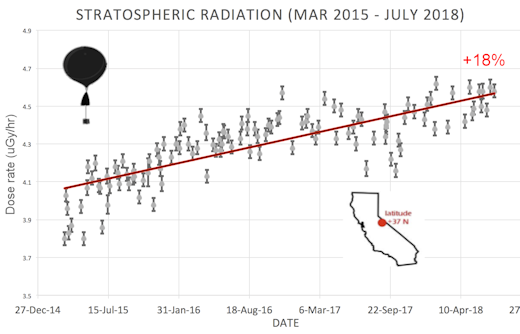
The data points in the graph above correspond to the peak of the Regener-Pfotzer maximum, which lies about 67,000 feet above central California. When cosmic rays crash into Earth's atmosphere, they produce a spray of secondary particles that is most intense at the entrance to the stratosphere. Physicists Eric Reneger and Georg Pfotzer discovered the maximum using balloons in the 1930s and it is what we are measuring today. En route to the stratosphere, our sensors also pass through aviation altitudes: 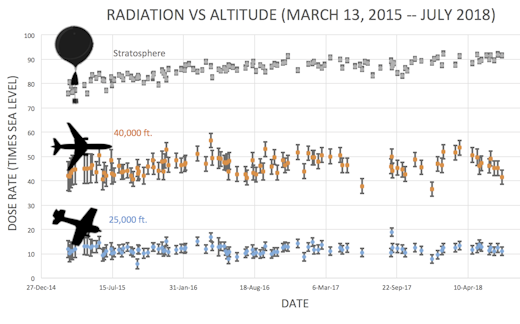
In this plot, dose rates are expessed as multiples of sea level. For instance, we see that boarding a plane that flies at 25,000 feet exposes passengers to dose rates ~10x higher than sea level. At 40,000 feet, the multiplier is closer to 50x. The radiation sensors onboard our helium balloons detect X-rays and gamma-rays in the energy range 10 keV to 20 MeV. These energies span the range of medical X-ray machines and airport security scanners. Why are cosmic rays intensifying? The main reason is the sun. Solar storm clouds such as coronal mass ejections (CMEs) sweep aside cosmic rays when they pass by Earth. During Solar Maximum, CMEs are abundant and cosmic rays are held at bay. Now, however, the solar cycle is swinging toward Solar Minimum, allowing cosmic rays to return. Another reason could be the weakening of Earth's magnetic field, which helps protect us from deep-space radiation. | | The official U.S. government space weather bureau | | | The first place to look for information about sundogs, pillars, rainbows and related phenomena. | | | Researchers call it a "Hubble for the sun." SDO is the most advanced solar observatory ever. | | | 3D views of the sun from NASA's Solar and Terrestrial Relations Observatory | | | Realtime and archival images of the Sun from SOHO. | | | from the NOAA Space Environment Center | | | fun to read, but should be taken with a grain of salt! Forecasts looking ahead more than a few days are often wrong. | | | from the NOAA Space Environment Center | | | the underlying science of space weather |  | To find reviews of new online casino sites in the UK try The Casino DB where there are hundreds of online casino reviews complete with bonuses and ratings. Get a bonus when playing at a new casino in the UK. The Genie got you covered! Looking for a new online casino? Try Casimpo the new site dedicated to making online casino simple and easy for all. | | | These links help Spaceweather.com stay online. Thank you to our supporters! | | | | | | | | |  | | |  | ©2019 Spaceweather.com. All rights reserved. This site is penned daily by Dr. Tony Phillips. | |


