 Right:
From thousands of observations, Cornell University scientists
have determined geographic subpoints for the southern edges of
auroral displays. The curves represent four values of the planetary
index (Kp). As this index increases, the aurora's southern edge
moves southward.
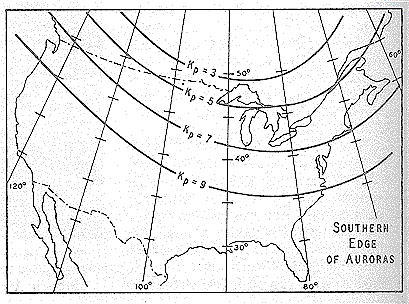
Right:
From thousands of observations, Cornell University scientists
have determined geographic subpoints for the southern edges of
auroral displays. The curves represent four values of the planetary
index (Kp). As this index increases, the aurora's southern edge
moves southward. In this article we briefly explain some of the ideas behind the association of the aurora with geomagnetic activity and a bit about how the ‘K-index’ or ‘K-factor’ works. The aurora is understood to be caused by the interaction of high energy particles (usually electrons) with neutral atoms in the earth's upper atmosphere. These high energy particles can ‘excite’ (by collisions) valence electrons that are bound to the neutral atom. The ‘excited’ electron can then ‘de-excite’ and return back to its initial, lower energy state, but in the process it releases a photon (a light particle). The combined effect of many photons being released from many atoms results in the aurora display that you see.
The details of how high energy particles are generated during geomagnetic storms constitute an entire discipline of space science in its own right. The basic idea, however, is that the Earth’s magnetic field (let us say the ‘geomagnetic field’) is responding to a outwardly propagating disturbance from the Sun. As the geomagnetic field adjusts to this disturbance, various components of the Earth’s field change form, releasing magnetic energy and thereby accelerating charged particles to high energies. These particles, being charged, are forced to stream along the geomagnetic field lines. Some end up in the upper part of the earth’s neutral atmosphere and the auroral mechanism begins.
The disturbance of the geomagnetic field may also be measured by an instrument called a magnetometer. At our operations center we receive magnetometer data from dozens of observatories in one minute intervals. The data is received at or near to ‘real-time’ and allows us to keep track of the current state of the geomagnetic conditions. In order to reduce the amount of data that our customers have to deal with we convert the magnetometer data into three-hourly indices which give a quantitative, but less detailed measure of the level of geomagnetic activity. The K-index scale has a range from 0 to 9 and is directly related to the maximum amount of fluctuation (relative to a quiet day) in the geomagnetic field over a three-hour interval.
The K-index is therefore updated every three hours and the information is made available to our customers as soon as possible. The K-index is also necessarily tied to a specific geomagnetic observatory. For locations where there are no observatories, one can only estimate what the local K-index would be by looking at data from the nearest observatory, but this would be subject to some errors from time to time because geomagnetic activity is not always spatially homogenous. Another item of interest is that the location of the aurora usually changes geomagnetic latitude as the intensity of the geomagnetic storm changes. The location of the aurora often takes on an ‘oval-like’ shape and is appropriately called the auroral oval. A useful map of the approximate location of the auroral oval as a function of the Kp-index was published in the June 1968 copy Sky & Telescope (see page 348). The Kp index is derived through by an algorithm that essentially averages the K-indices from several stations. Note that as a storm becomes more intense, the edge of the auroral boundary typically moves to lower latitudes.
For further reading we can recommend a couple of books for you. An old, but classic text is The Polar Aurora, Oxford University Press, 1955, by Störmer. A more modern text is The Physics of Space Plasmas, 1991, by George Parks. If you are interested in real-time reporting of geomagnetic activity please make use of our 24-hour/day, 7 day/week services. We have an internet home page address (/), and a recorded message which is updated every three hours or as major activity occurs (303-497-3235). You can also reach us at 303-497-3204. We hope that you find this information helpful. If you have some further questions please don’t hesitate to let us know. Best wishes ! Chris Balch (cbalch [at] sec.noaa.gov)