Never miss another geomagnetic storm. Sign up for Space Weather Alerts and you'll receive a text message when auroras appear in your area. Aurora tour guides and professional astronomers use this service. Now you can, too! | | |
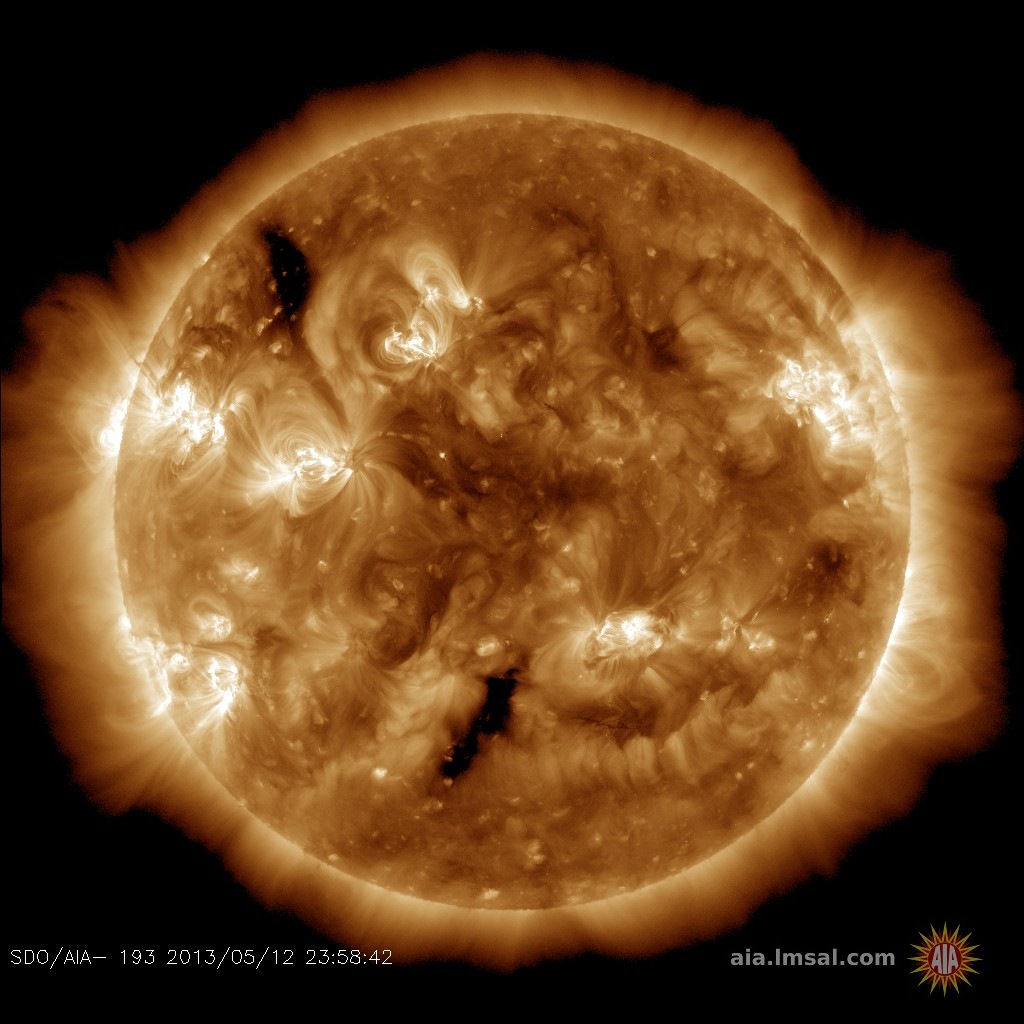
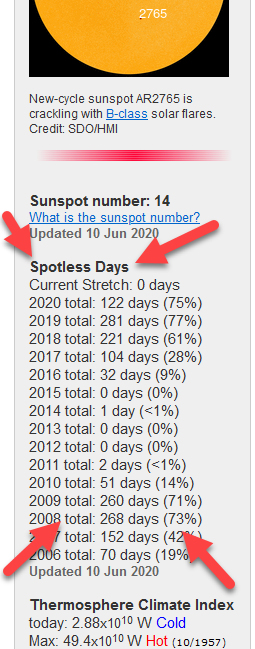
SIGNS OF LIFE FROM THE SUN: For the past few years, we've paid special attention to days without sunspots. But what about days with sunspots? Suddenly, it makes sense to talk about this again because the sun is showing signs of life. This month we've had a sunspot almost every day--11 out of 12 days so far. New Solar Cycle 25 is gaining strength, and it could bring an end to Solar Minimum during 2020. Solar flare alerts: SMS Text.
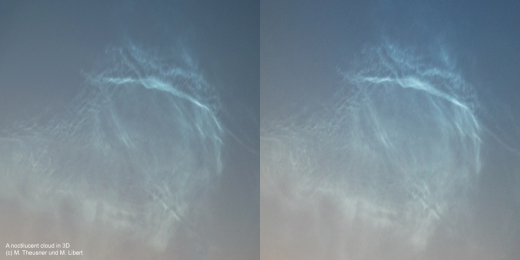
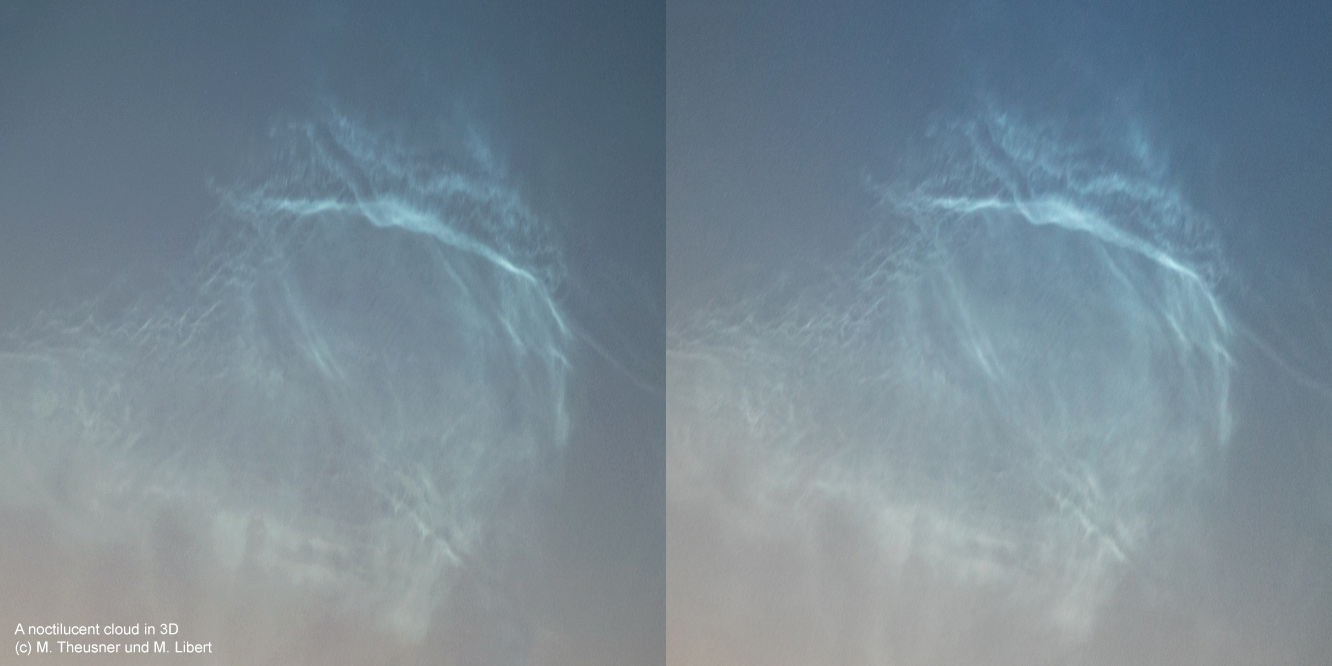
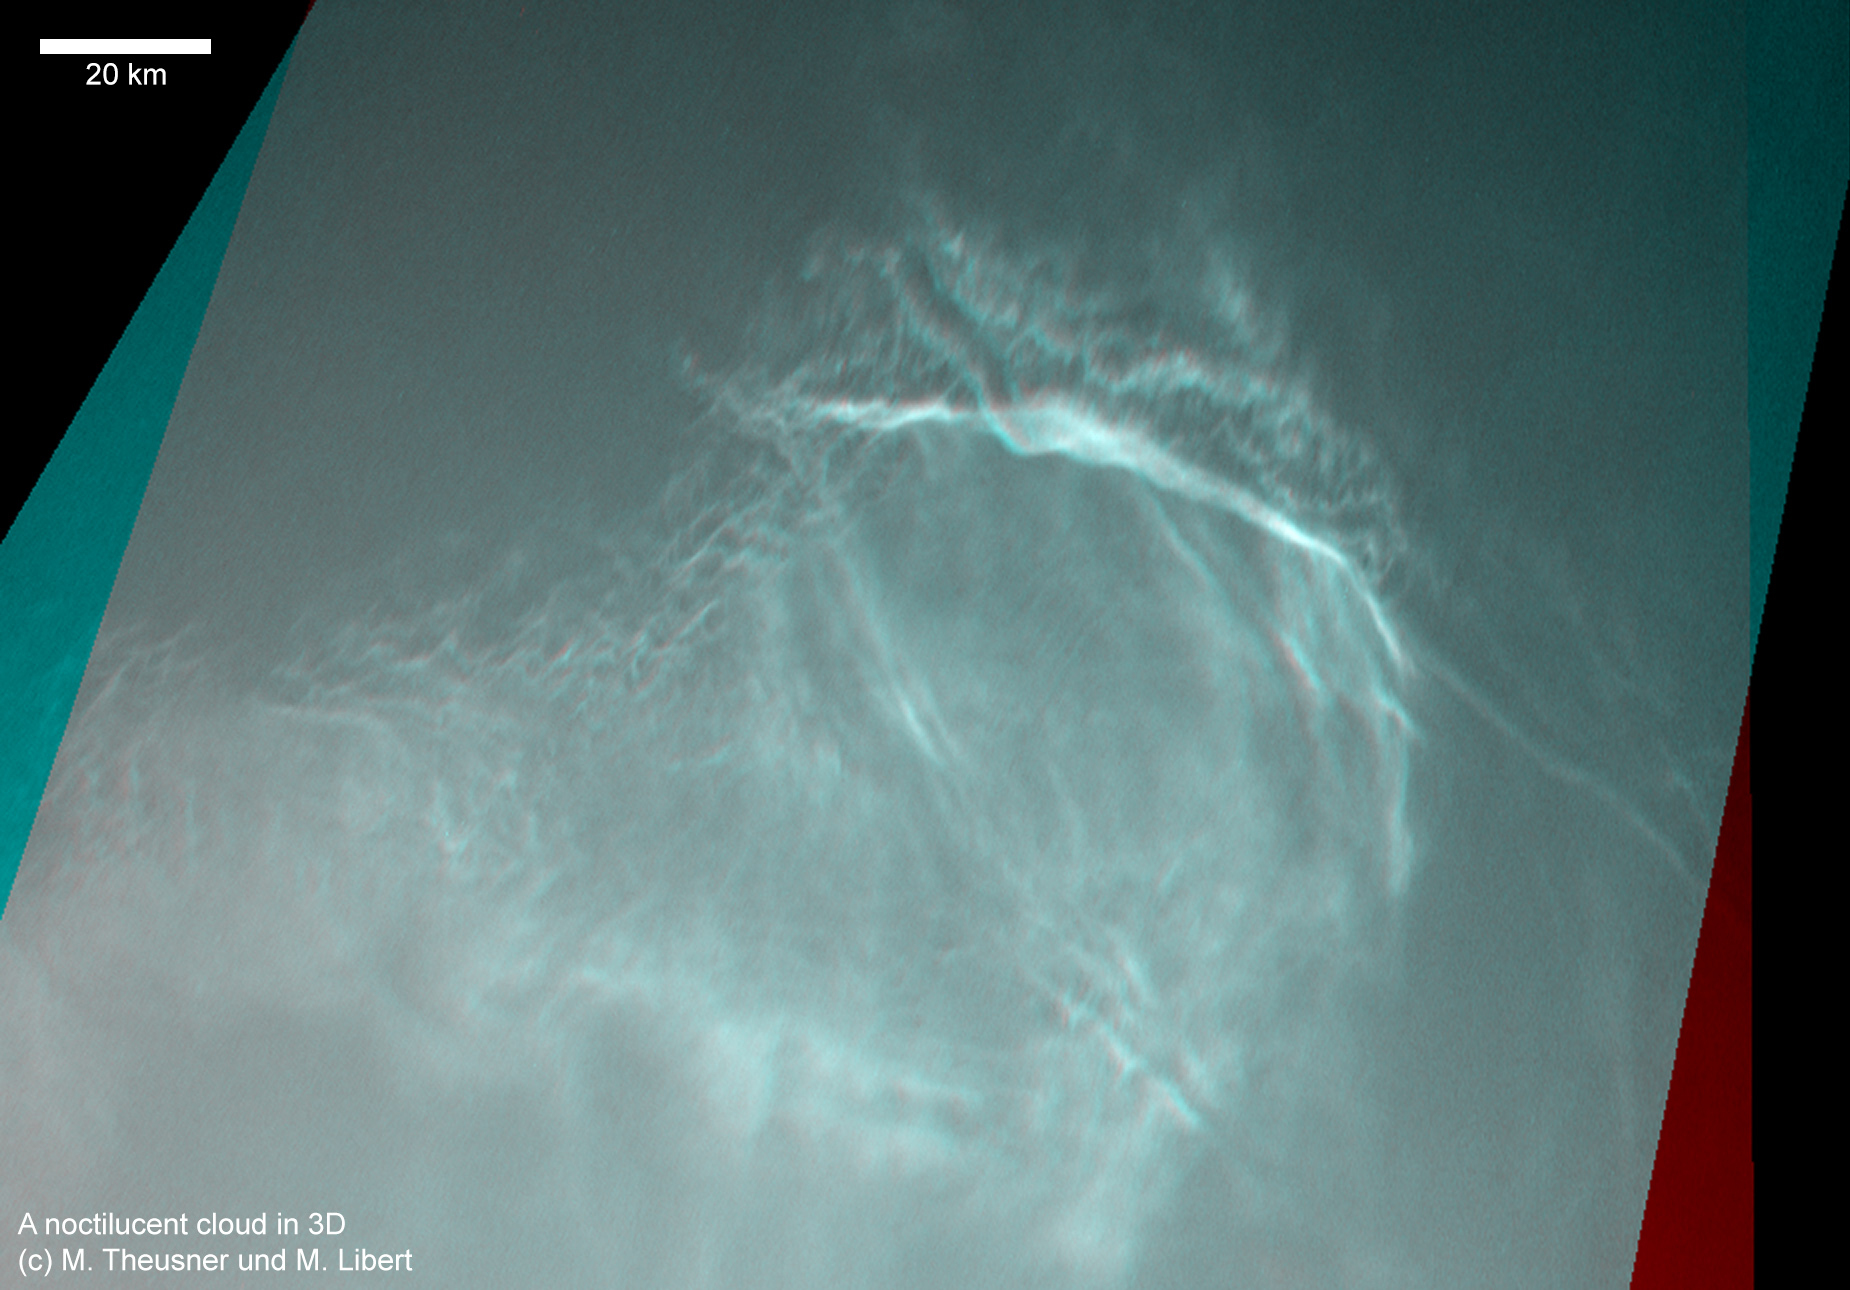
3D NOCTILUCENT CLOUDS: After more than 100 years of study, much remains unknown about noctilucent clouds (NLCs). Seeded by meteoroids, they float near the edge of space in a layer of the mesosphere no more than a few km thick. How are the clouds arranged inside that narrow layer? Two German photographers decided to find out. During a bright display of NLCs over Germany on June 7th, Michael Theusner and Maciej Libert photographed the same clouds from two cities 120 km apart:
"The long baseline of 120 km allowed us to construct a real 3D image of that cloud," says Theusner. "First, we re-projected the images onto the ground. Then, we created an anaglyph from the undistorted images. Here it is. Using red/cyan glasses, you can see the true 3D-structure of that cloud."
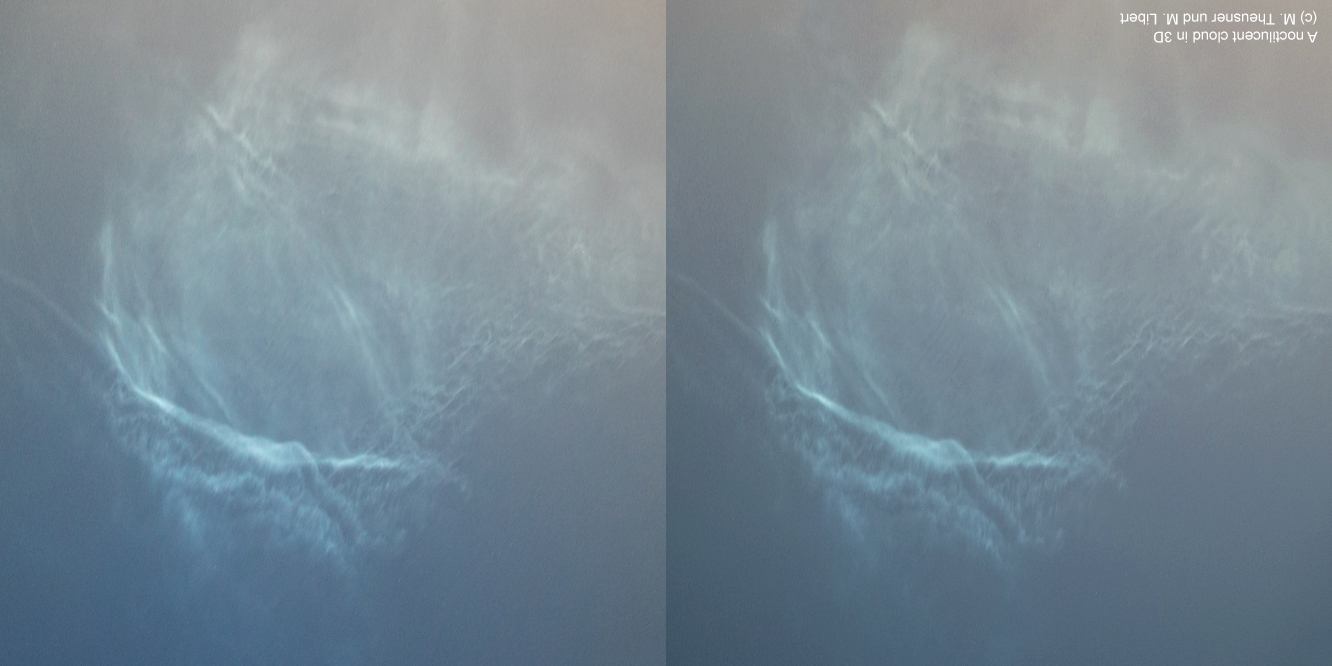
Many readers won't have 3D glasses. For them, Theusner created a no-glasses version, shown below. Cross your eyes to merge the two images, and relax your stare into infinity to see the cloud's 3D structure.
Click to expand this image!
For some people, a flipped version might be easier.
The most striking feature of the 3D view is a fold in the cloud. In a wide arc across the top of the image, one layer of frosted meteor smoke is clearly floating atop another.
"The cloud is shown as if viewed from below," adds Theusner. "Thus, structure closer to you is closer to the ground. From the images and their geolocation, the average altitude of the cloud of 84 km could be deduced. Its lowest parts were at 83 km and its highest at 85 km."
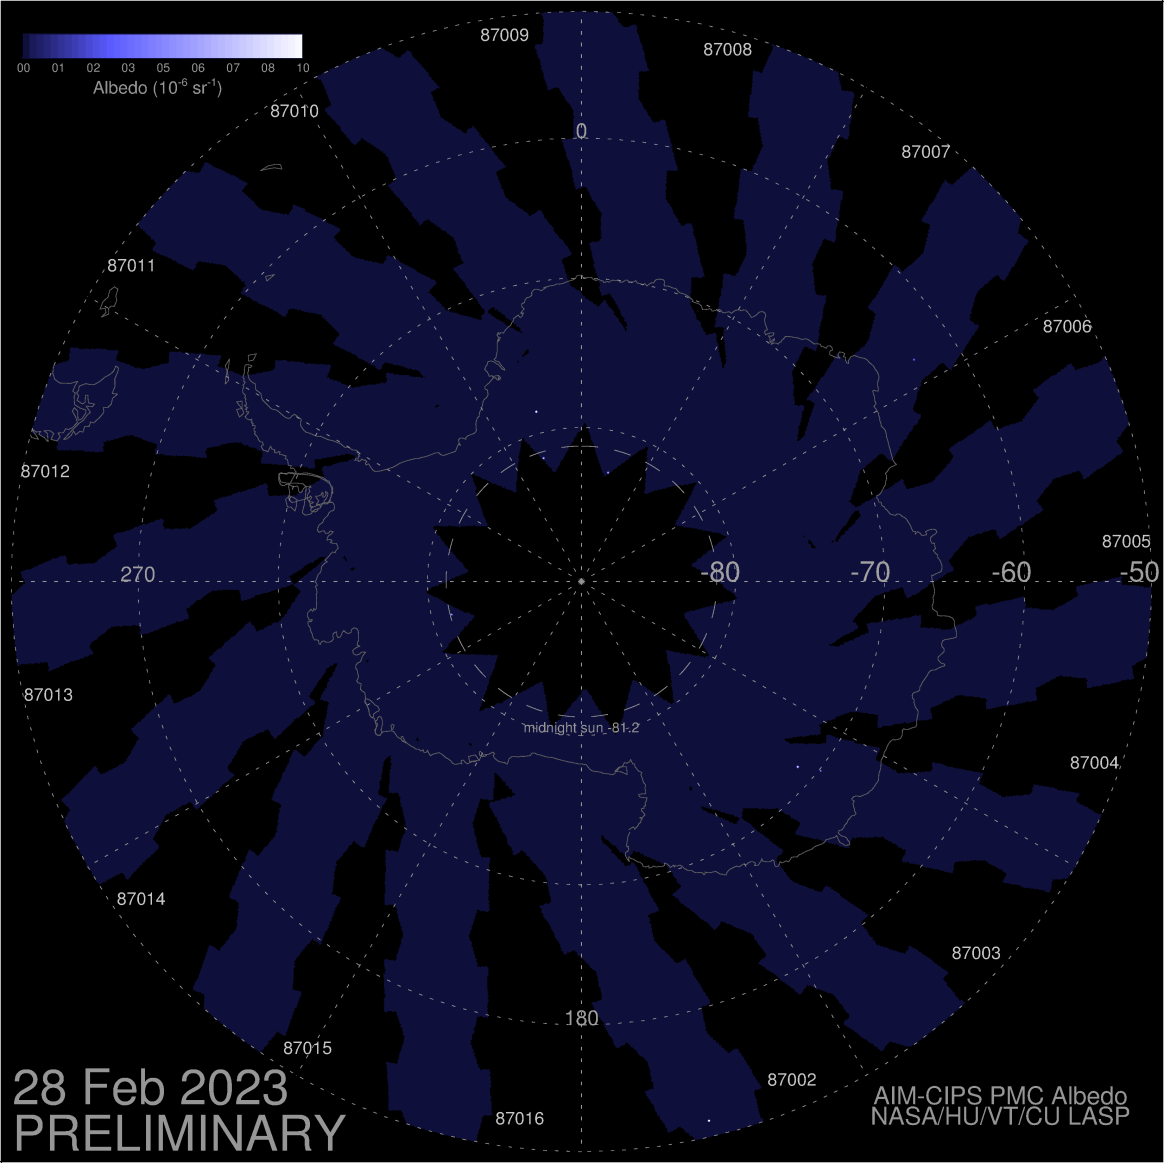
Researchers using NASA's AIM spacecraft have tried something similar. AIM is located high above the clouds, taking pictures as it orbits over the poles. In 2018, a team led by Vern Hart of Utah Valley University combined successive AIM snapshots to create 3D images of NLCs from space. Their work revealed ripples caused by atmospheric gravity waves with bright troughs and dimmer crests.
Realtime Noctilucent Cloud Photo Gallery
Free: Spaceweather.com Newsletter
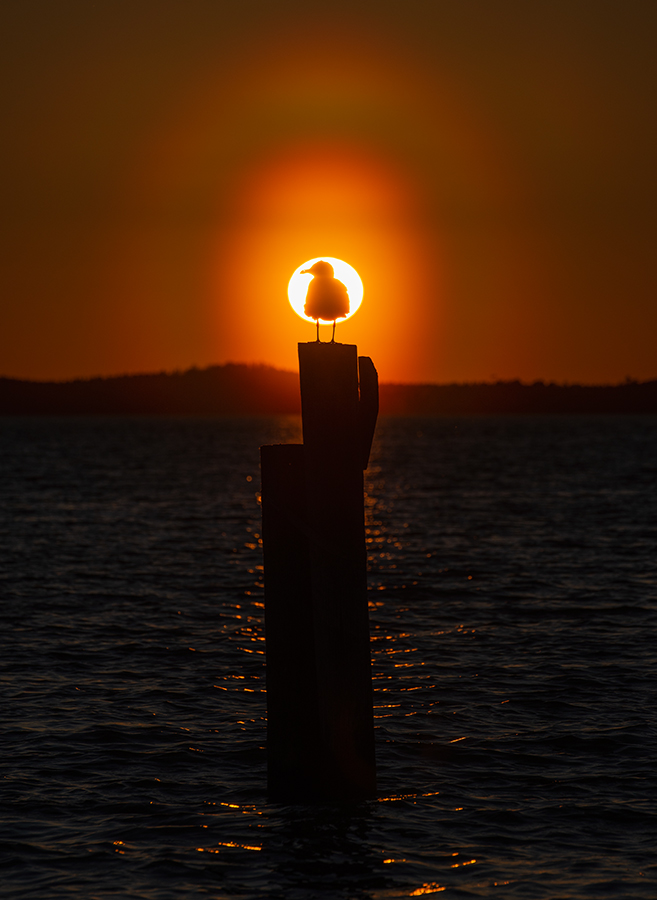
THIS IS NOT A PHOTO OF A SEAGULL: When you look at this picture, the first thing you probably notice is the seagull. But that's not what photographer Lasse Nurminen was aiming at. "I was after the pollen corona," he says. Note the oval rings of light around the sun behind the seagull:
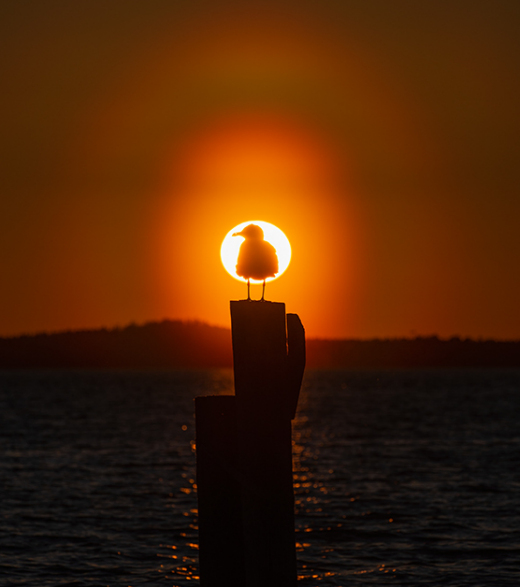
Coronas are rings of light produced by sunlight scattering from the outsides of small particles--in this case, pollens. At this time of year, the air in southern Finland where Nurminen lives is often sprinkled with pine pollen. When clouds of the allergen drift in front of the sun, a pollen corona appears.
Pollens are non-spherical--and this adds to their magic. Pine pollens have air sacs to help carry them in the wind. These align the grains so that their coronas are elliptical. This effect may be seen in Nurminen's coronas, which are taller than they are wide.
Realtime Space Weather Photo Gallery
Free: Spaceweather.com Newsletter
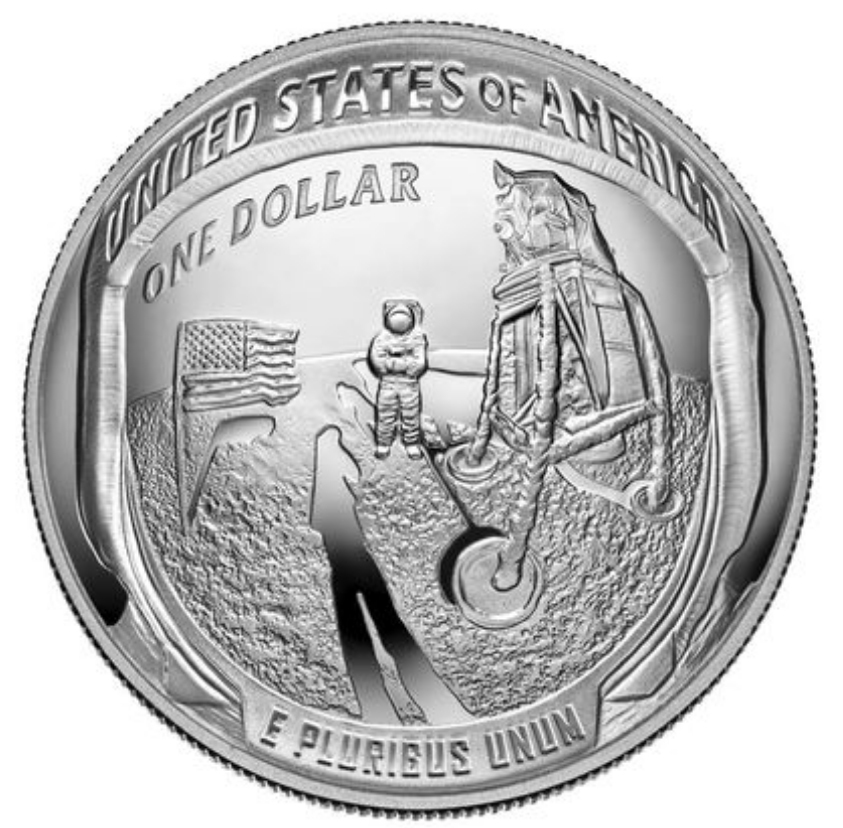
APOLLO 11 PROOF SILVER DOLLAR (COLLECTOR'S ITEM): Are you looking for a far-out Father's Day gift? Consider this: On July 20, 2019 (the 50th anniversary of the Apollo 11 Moon landing), the students of Earth to Sky Calculus flew this rare proof silver dollar to the stratosphere:
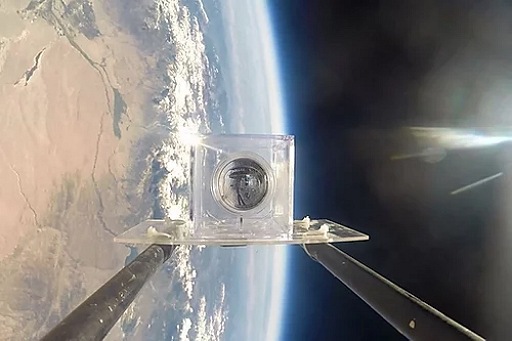
The US Mint created the coins to celebrate the first Moon landing--but you can no longer buy them from the Mint. You can, however, get one from Earth to Sky Calculus. The students are selling the collector's item for $229.95 to support their cosmic ray ballooning program.
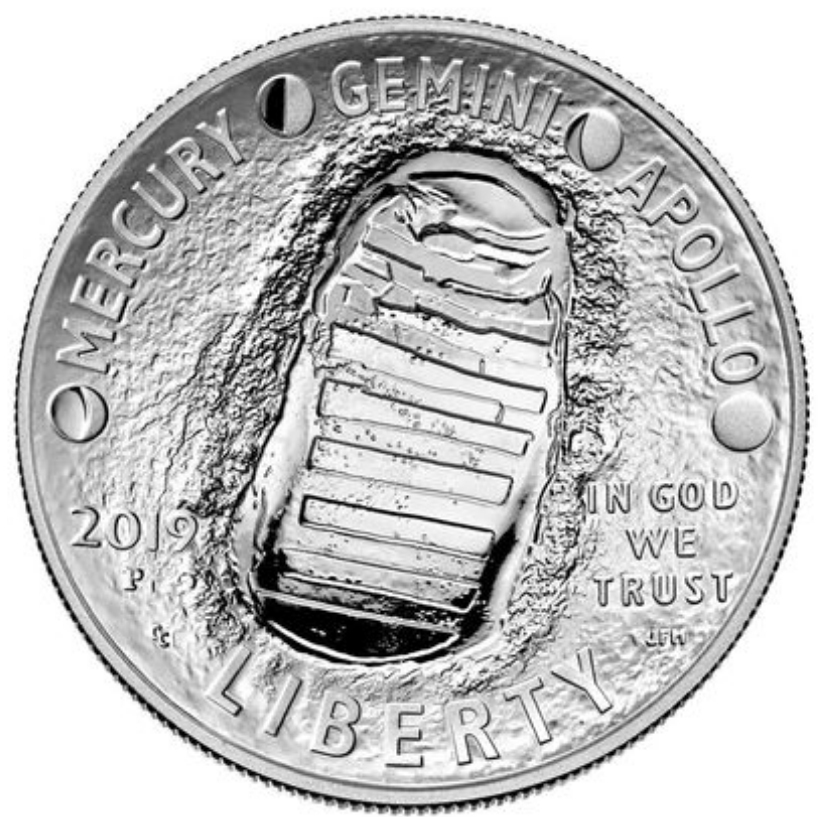
The silver dollar is curved and reproduces the helmet of astronaut Buzz Aldrin. Reflected in Buzz's visor are Neil Armstrong, the United States flag, and the lunar lander. The opposite side of the coin shows Neil's iconic footprint on the Moon. Included is a greeting card showing the coin in flight and a certificate of authenticity.
Far Out Gifts: Earth to Sky Store
All sales support hands-on STEM education
Realtime Aurora Photo Gallery
Free: Spaceweather.com Newsletter
Every night, a network of
NASA all-sky cameras scans the skies above the United States for meteoritic fireballs. Automated software maintained by NASA's Meteoroid Environment Office calculates their orbits, velocity, penetration depth in Earth's atmosphere and many other characteristics. Daily results are presented here on Spaceweather.com.
On June 12, 2020, the network reported 12 fireballs.
(11 sporadics, 1 Daytime Arietid)
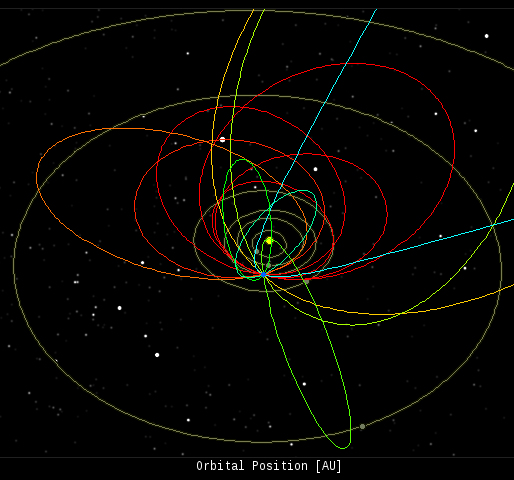
In this diagram of the inner solar system, all of the fireball orbits intersect at a single point--Earth. The orbits are color-coded by velocity, from slow (red) to fast (blue). [Larger image] [movies]
Potentially Hazardous Asteroids (
PHAs) are space rocks larger than approximately 100m that can come closer to Earth than 0.05 AU. None of the known PHAs is on a collision course with our planet, although astronomers are finding
new ones all the time.
On June 12, 2020 there were 2037 potentially hazardous asteroids.
 |
Recent & Upcoming Earth-asteroid encounters: | Asteroid | Date(UT) | Miss Distance | Velocity (km/s) | Diameter (m) |
| 2020 KA7 | 2020-Jun-07 | 10.4 LD | 7.3 | 31 |
| 2020 KK3 | 2020-Jun-07 | 17.8 LD | 11.9 | 29 |
| 2013 XA22 | 2020-Jun-08 | 7.6 LD | 6.7 | 98 |
| 2020 KZ3 | 2020-Jun-08 | 3.2 LD | 6 | 21 |
| 2020 KY | 2020-Jun-10 | 17.3 LD | 2.4 | 20 |
| 2020 LF | 2020-Jun-10 | 4.9 LD | 8.9 | 30 |
| 2020 JQ2 | 2020-Jun-11 | 15.2 LD | 4.5 | 25 |
| 2020 JS1 | 2020-Jun-11 | 9.9 LD | 5 | 19 |
| 2020 JU1 | 2020-Jun-13 | 19 LD | 6.6 | 49 |
| 2020 LC | 2020-Jun-13 | 12.4 LD | 7.7 | 50 |
| 2020 KB3 | 2020-Jun-13 | 3.2 LD | 7.5 | 37 |
| 2017 MF7 | 2020-Jun-14 | 3.7 LD | 10.9 | 23 |
| 2020 KP6 | 2020-Jun-16 | 3.6 LD | 10.8 | 41 |
| 2020 JU3 | 2020-Jun-17 | 6.9 LD | 10.9 | 55 |
| 2020 KF3 | 2020-Jun-17 | 12.5 LD | 3.5 | 15 |
| 2020 LG | 2020-Jun-18 | 8.9 LD | 10.6 | 49 |
| 2018 PD22 | 2020-Jun-19 | 17.2 LD | 14.6 | 56 |
| 2020 KR1 | 2020-Jun-22 | 11.6 LD | 6.8 | 42 |
| 441987 | 2020-Jun-24 | 9.8 LD | 12.9 | 186 |
| 2017 FW128 | 2020-Jun-25 | 6.9 LD | 5.4 | 11 |
| 2020 KQ7 | 2020-Jun-27 | 10.3 LD | 2.6 | 18 |
| 2020 JX1 | 2020-Jun-29 | 3.3 LD | 5 | 60 |
| 2019 AC3 | 2020-Jul-01 | 10.5 LD | 3.4 | 12 |
| 2007 UN12 | 2020-Jul-04 | 16.7 LD | 2.9 | 6 |
| 2020 KJ7 | 2020-Jul-13 | 11.9 LD | 3.4 | 30 |
| 2009 OS5 | 2020-Jul-13 | 17.6 LD | 2.6 | 45 |
| 2016 DY30 | 2020-Jul-19 | 9 LD | 15.1 | 3 |
| 2002 BF25 | 2020-Jul-21 | 9.4 LD | 6.8 | 129 |
| 2018 PY7 | 2020-Jul-31 | 8.9 LD | 9.5 | 16 |
| 2007 RF1 | 2020-Jul-31 | 10.7 LD | 5 | 21 |
| 2018 BD | 2020-Aug-03 | 7.6 LD | 9.4 | 3 |
| 2009 PQ1 | 2020-Aug-05 | 10.8 LD | 13.5 | 112 |
Notes: LD means "Lunar Distance." 1 LD = 384,401 km, the distance between Earth and the Moon. 1 LD also equals 0.00256 AU. MAG is the visual magnitude of the asteroid on the date of closest approach. | | Cosmic Rays in the Atmosphere |
SOMETHING NEW! We have developed a new predictive model of aviation radiation. It's called E-RAD--short for Empirical RADiation model. We are constantly flying radiation sensors onboard airplanes over the US and and around the world, so far collecting more than 22,000 gps-tagged radiation measurements. Using this unique dataset, we can predict the dosage on any flight over the USA with an error no worse than 15%.
E-RAD lets us do something new: Every day we monitor approximately 1400 flights criss-crossing the 10 busiest routes in the continental USA. Typically, this includes more than 80,000 passengers per day. E-RAD calculates the radiation exposure for every single flight.
The Hot Flights Table is a daily summary of these calculations. It shows the 5 charter flights with the highest dose rates; the 5 commercial flights with the highest dose rates; 5 commercial flights with near-average dose rates; and the 5 commercial flights with the lowest dose rates. Passengers typically experience dose rates that are 20 to 70 times higher than natural radiation at sea level.
To measure radiation on airplanes, we use the same sensors we fly to the stratosphere onboard Earth to Sky Calculus cosmic ray balloons: neutron bubble chambers and X-ray/gamma-ray Geiger tubes sensitive to energies between 10 keV and 20 MeV. These energies span the range of medical X-ray machines and airport security scanners.
Column definitions: (1) The flight number; (2) The maximum dose rate during the flight, expressed in units of natural radiation at sea level; (3) The maximum altitude of the plane in feet above sea level; (4) Departure city; (5) Arrival city; (6) Duration of the flight.
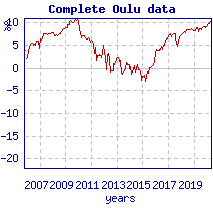
SPACE WEATHER BALLOON DATA: Approximately once a week, Spaceweather.com and the students of Earth to Sky Calculus fly space weather balloons to the stratosphere over California. These balloons are equipped with radiation sensors that detect cosmic rays, a surprisingly "down to Earth" form of space weather. Cosmic rays can seed clouds, trigger lightning, and penetrate commercial airplanes. Furthermore, there are studies ( #1, #2, #3, #4) linking cosmic rays with cardiac arrhythmias and sudden cardiac death in the general population. Our latest measurements show that cosmic rays are intensifying, with an increase of more than 18% since 2015:
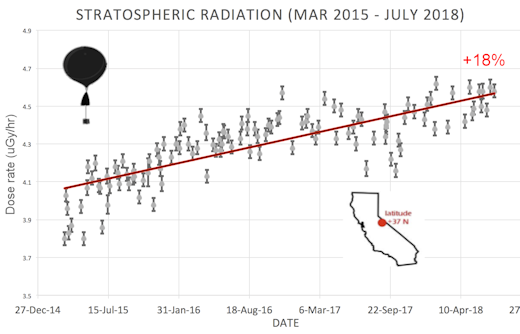
The data points in the graph above correspond to the peak of the Regener-Pfotzer maximum, which lies about 67,000 feet above central California. When cosmic rays crash into Earth's atmosphere, they produce a spray of secondary particles that is most intense at the entrance to the stratosphere. Physicists Eric Reneger and Georg Pfotzer discovered the maximum using balloons in the 1930s and it is what we are measuring today.
En route to the stratosphere, our sensors also pass through aviation altitudes:
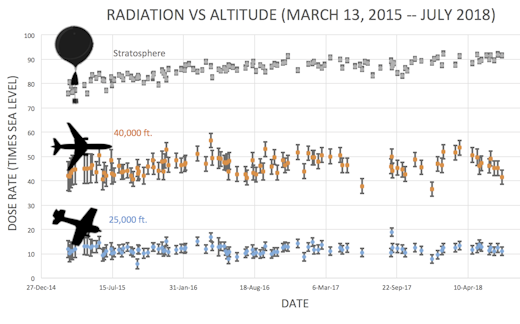
In this plot, dose rates are expessed as multiples of sea level. For instance, we see that boarding a plane that flies at 25,000 feet exposes passengers to dose rates ~10x higher than sea level. At 40,000 feet, the multiplier is closer to 50x.
The radiation sensors onboard our helium balloons detect X-rays and gamma-rays in the energy range 10 keV to 20 MeV. These energies span the range of medical X-ray machines and airport security scanners.
Why are cosmic rays intensifying? The main reason is the sun. Solar storm clouds such as coronal mass ejections (CMEs) sweep aside cosmic rays when they pass by Earth. During Solar Maximum, CMEs are abundant and cosmic rays are held at bay. Now, however, the solar cycle is swinging toward Solar Minimum, allowing cosmic rays to return. Another reason could be the weakening of Earth's magnetic field, which helps protect us from deep-space radiation.
| | The official U.S. government space weather bureau |
| | The first place to look for information about sundogs, pillars, rainbows and related phenomena. |
| | Researchers call it a "Hubble for the sun." SDO is the most advanced solar observatory ever. |
| | 3D views of the sun from NASA's Solar and Terrestrial Relations Observatory |
| | Realtime and archival images of the Sun from SOHO. |
| | from the NOAA Space Environment Center |
| | fun to read, but should be taken with a grain of salt! Forecasts looking ahead more than a few days are often wrong. |
| | from the NOAA Space Environment Center |
| | the underlying science of space weather |
 | To find reviews of new online casino sites in the UK try The Casino DB where there are hundreds of online casino reviews complete with bonuses and ratings. Get a bonus when playing at a new casino in the UK. The Genie got you covered! Looking for a new online casino? Try Casimpo the new site dedicated to making online casino simple and easy for all. |
| | These links help Spaceweather.com stay online. Thank you to our supporters! |
| | | | | | |


