Marianne’s Arctic tours: Operating in small groups of 7 to 14 persons--all needs supplied for safety, comfort and pleasure. Night & day photography or non-photographic landscape - wildlife tours. Click for details! | | |
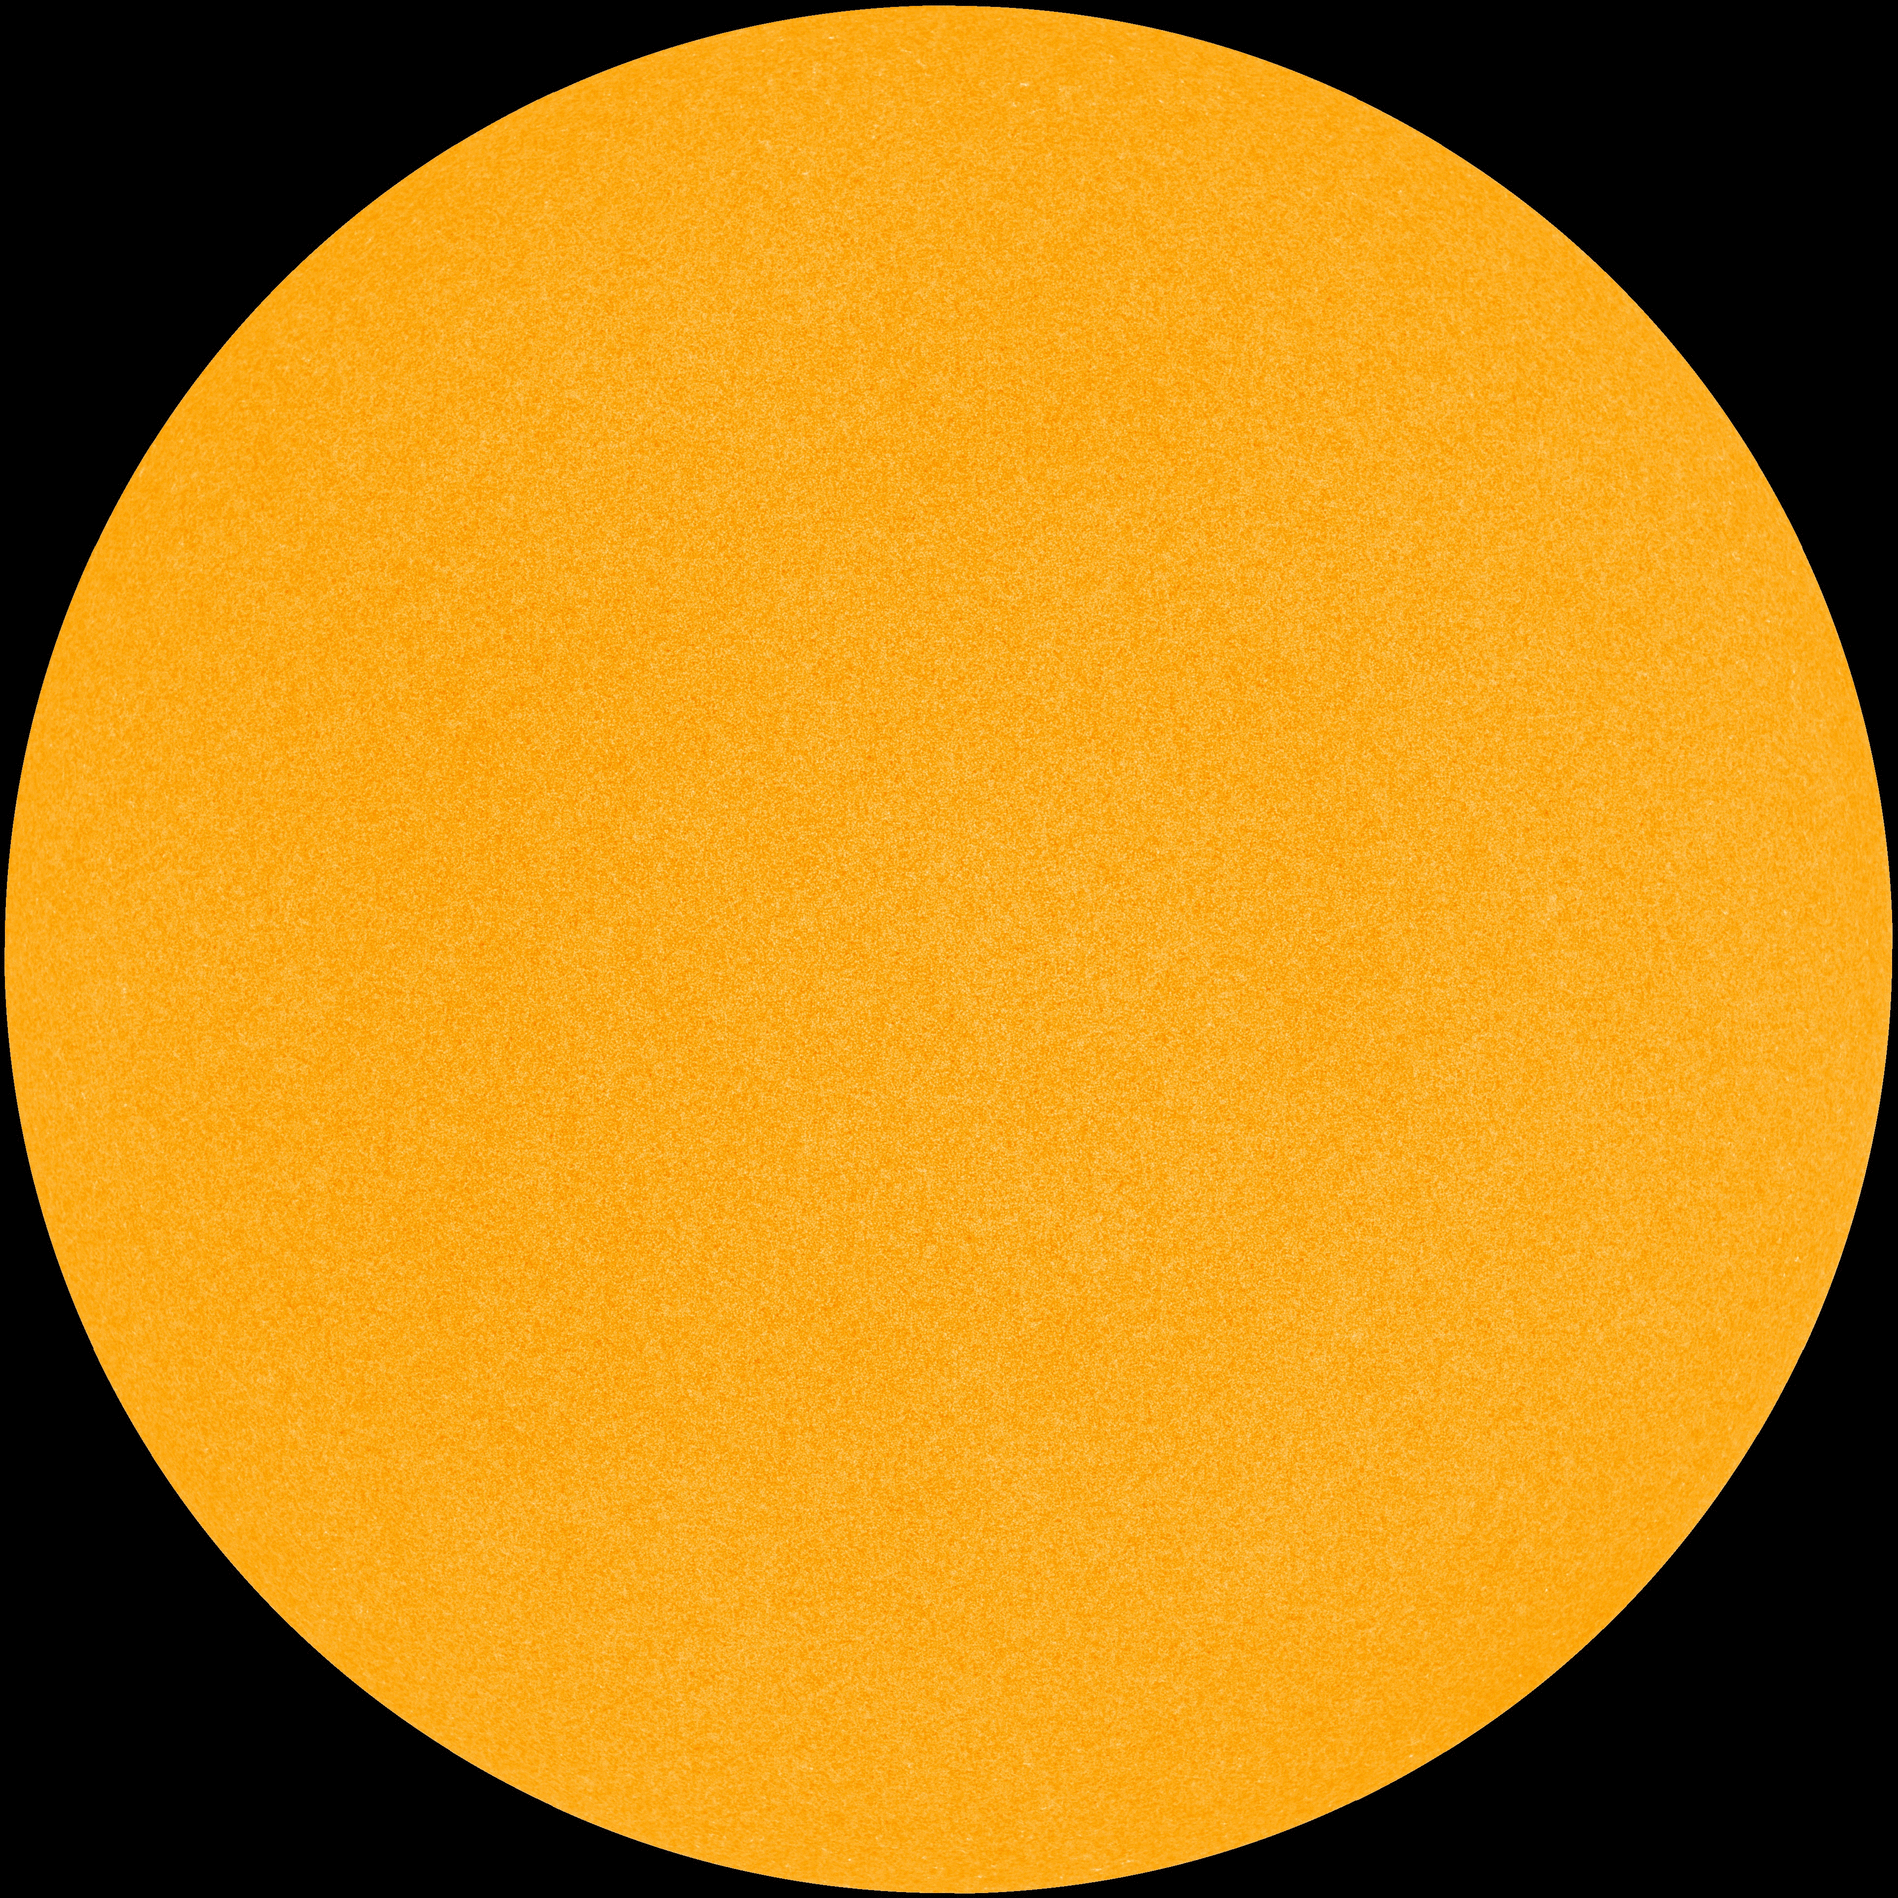
ALL QUIET ALERT: Solar activity is very low as the solar cycle continues its dip into the nadir of a deep Solar Minimum. There's not even a solar wind stream on the horizon. The next significant gust of solar wind is not expected for at least a week. Stay tuned for quiet. Aurora Alerts: SMS Text.
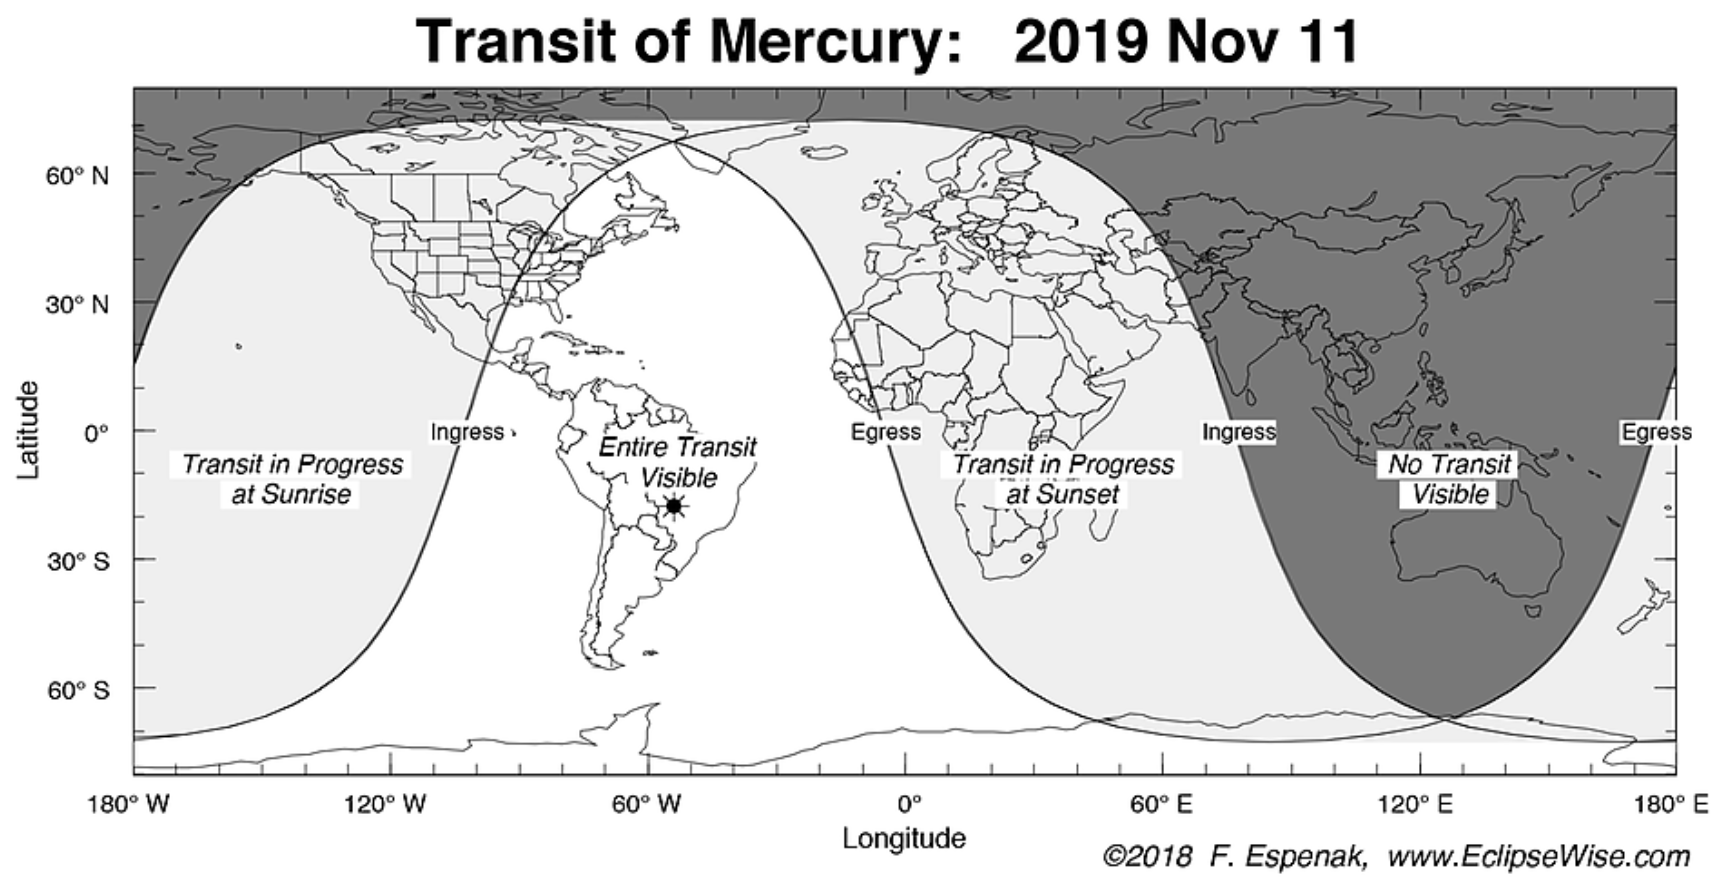
JUST ONE WEEK UNTIL THE TRANSIT OF MERCURY: One of the biggest astronomy events of the year is just one week away: The Transit on Mercury. On Monday, Nov 11th, Mercury will pass directly in front the sun. The rare transit begins at 12:35 UT (7:35 am EST) and lasts for almost six hours. Mercury's tiny form—jet black and perfectly round—will glide slowly across the solar disk, like this:
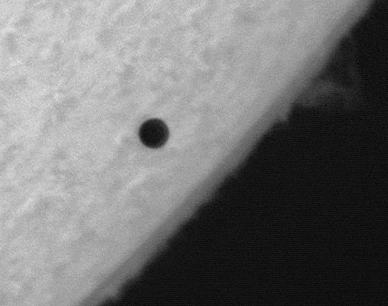
Credit: Tom Polakis of Tempe AZ made this movie of a previous Mercury transit on May 9, 2016. [more]
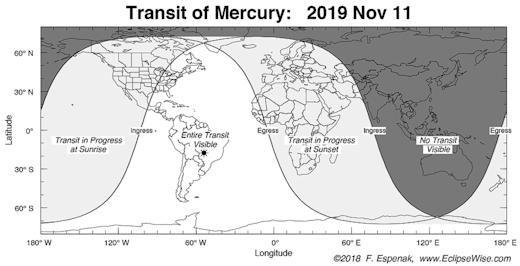
People in every continent except Australia can see at least a portion of the crossing. In the USA, the best place to be is on the Atlantic coast, where the entire transit will be visible. On the Pacific coast the transit will already be in progress at sunrise.
Warning! Do not stare at the sun during the transit. Mercury covers only a tiny fraction of the solar disk, so the sun remains as bright as ever. Eye damage can occur.
Ordinary eclipse glasses will keep your eyes safe, but they won't do much to help you see tiny Mercury. The planet is only 1/194th of the sun's apparent diameter. To watch this event, a safely-filtered telescope with a magnification of 50x or more is recommended. Don't have a filter? No problem. Images of the transit may be easily projected onto a wall or screen through an unfiltered telescope. Just do not look through the eye piece!
Nothing beats a telescope equipped with an H-alpha filter. H-alpha filters are narrowly tuned to the red glow of solar hydrogen. They reveal the sun as a boiling inferno cross-crossed by dark seething magnetic filaments. On Nov. 11th, the tiny form of Mercury will navigate this starscape. Here's a sample H-alpha image taken during the last transit of Mercury on May 9, 2016:
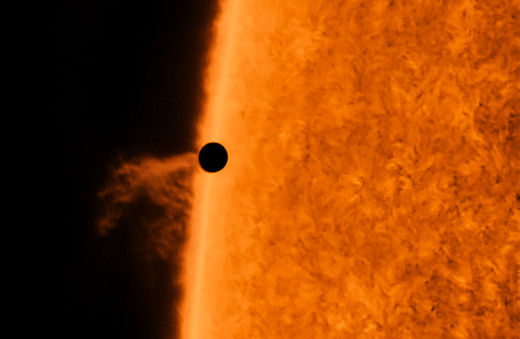
Paul Andrew took the picture from his backyard observatory in St. Margarets at Cliffe, Dover, UK. "The background prominence made Mercury look like it had a comet's tail," he says. More images may be found here and here.
Transits of Mercury occur only 13 times each century. The next one won't occur until Nov. 13, 2032. Don't miss this unusual event!
Realtime Spaceweather Photo Gallery
Free: Spaceweather.com Newsletter
DARTH VADER VISITS THE STRATOSPHERE: Impressive. Most impressive. On Nov. 2nd, the students of Earth to Sky Calculus launched a cosmic ray balloon to the stratosphere. Darth Vader went along for the ride, floating 109,580 feet above the rugged Sierra Nevada mountains of central California:
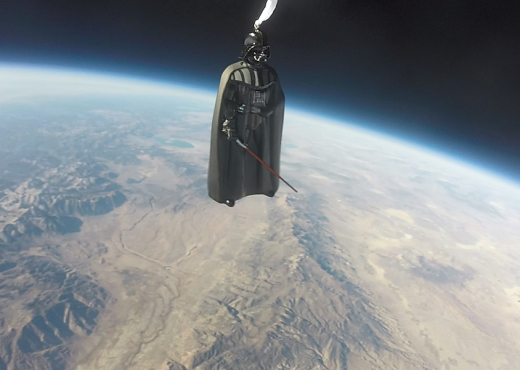
You can have him for $97.95. The students are selling Vader to support their cosmic ray ballooning program. This 5-inch tall blown glass ornament will look great on your holiday tree. It comes with a greeting card showing the Sith Lord in flight and telling the story of his journey to the edge of space and back again.
Far Out Gifts: Earth to Sky Store
All sales support hands-on STEM education
LOW SOLAR ACTIVITY REVEALS RED AURORAS: For the past two nights, geomagnetic activity has been very low. With no sunspots, no solar flares, and no significant streams of solar wind to disturb our planet's magnetic field, the forecast called for no auroras. Yet, auroras appeared anyway--"and they were crazy red," reports Markus Varik of Tromsø, Norway:
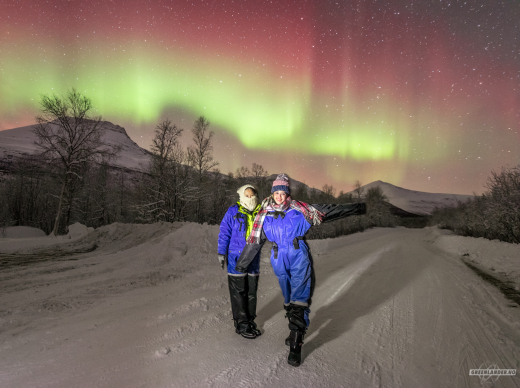
"On Saturday night, Abisko got all red. Sunday was our turn," says Varik. "It was great to see these rare red auroras from our own backyard."
Where did the red come from? The answer, ironically, may be low solar activity.
Varik's backyard is located beneath Earth's persistent auroral oval. A gentle rain of solar wind electrons guided to Earth by our planet's curved magnetic field creates a polar ring of Northern Lights that intersects the latitude of Tromsø. The auroral oval doesn't need a solar storm. It just glows.
Here's the thing about the auroral oval. It's green on the bottom and red on top. (Green is the color of molecular oxygen; red is the color of atomic oxygen.) When the auroral oval contracts during periods of low solar activity, residents of Tromsø can see over the top--that is, they see red.
"Those electrons cooked up something really nice," says Varik--no sunspots required.
Realtime Aurora Photo Gallery
Free: Spaceweather.com Newsletter
Every night, a network of
NASA all-sky cameras scans the skies above the United States for meteoritic fireballs. Automated software maintained by NASA's Meteoroid Environment Office calculates their orbits, velocity, penetration depth in Earth's atmosphere and many other characteristics. Daily results are presented here on Spaceweather.com.
On Nov. 04, 2019, the network reported 17 fireballs.
(11 sporadics, 3 Orionids, 2 northern Taurids, 1 chi Taurid)
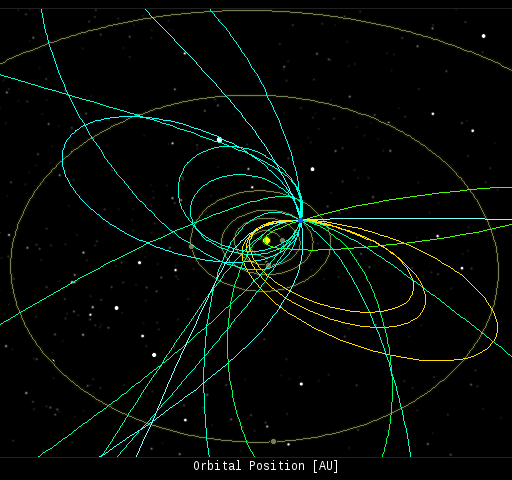
In this diagram of the inner solar system, all of the fireball orbits intersect at a single point--Earth. The orbits are color-coded by velocity, from slow (red) to fast (blue). [Larger image] [movies]
Potentially Hazardous Asteroids (
PHAs) are space rocks larger than approximately 100m that can come closer to Earth than 0.05 AU. None of the known PHAs is on a collision course with our planet, although astronomers are finding
new ones all the time.
On November 4, 2019 there were 2018 potentially hazardous asteroids.
 |
Recent & Upcoming Earth-asteroid encounters: | Asteroid | Date(UT) | Miss Distance | Velocity (km/s) | Diameter (m) |
| 2019 UH7 | 2019-Oct-30 | 10 LD | 6.2 | 11 |
| 2019 UM8 | 2019-Oct-30 | 5.9 LD | 7 | 7 |
| 2019 UJ3 | 2019-Oct-31 | 7.3 LD | 8.6 | 23 |
| 2019 UN13 | 2019-Oct-31 | 0 LD | 12.8 | 1 |
| 2019 VA1 | 2019-Oct-31 | 2.2 LD | 11.2 | 11 |
| 2019 UF9 | 2019-Oct-31 | 2 LD | 10.3 | 8 |
| 2019 UG12 | 2019-Nov-01 | 4 LD | 11.9 | 20 |
| 2019 UP7 | 2019-Nov-01 | 15.5 LD | 9.4 | 25 |
| 2019 UM4 | 2019-Nov-01 | 11.1 LD | 9.2 | 20 |
| 2019 UD13 | 2019-Nov-01 | 15.3 LD | 23.2 | 72 |
| 2019 UG11 | 2019-Nov-01 | 0.5 LD | 10.1 | 17 |
| 2019 UR12 | 2019-Nov-02 | 9.8 LD | 6.7 | 47 |
| 2019 VA | 2019-Nov-02 | 0.3 LD | 8.6 | 8 |
| 2019 UU3 | 2019-Nov-02 | 13.3 LD | 13.9 | 30 |
| 2015 JD1 | 2019-Nov-03 | 12.9 LD | 11.9 | 269 |
| 2019 UL8 | 2019-Nov-03 | 2.8 LD | 12.8 | 19 |
| 2019 UH3 | 2019-Nov-03 | 10.4 LD | 8.5 | 24 |
| 2019 VD | 2019-Nov-04 | 0.5 LD | 12 | 12 |
| 2019 VR | 2019-Nov-04 | 0.4 LD | 9.6 | 9 |
| 2019 UH5 | 2019-Nov-05 | 13.3 LD | 3.5 | 12 |
| 2019 VU | 2019-Nov-05 | 2.7 LD | 15.4 | 12 |
| 2019 UE13 | 2019-Nov-06 | 8.3 LD | 8.9 | 26 |
| 2019 UM13 | 2019-Nov-06 | 11.5 LD | 5.9 | 17 |
| 2019 UL4 | 2019-Nov-07 | 16.7 LD | 9 | 30 |
| 2019 UO7 | 2019-Nov-07 | 3.8 LD | 4.1 | 10 |
| 2019 VM1 | 2019-Nov-08 | 11.3 LD | 6.1 | 19 |
| 2019 UM12 | 2019-Nov-08 | 1.3 LD | 13.6 | 41 |
| 2019 UR4 | 2019-Nov-08 | 7.3 LD | 4.5 | 15 |
| 2019 UB7 | 2019-Nov-10 | 13.7 LD | 17.5 | 56 |
| 2019 VN | 2019-Nov-11 | 3.1 LD | 13.6 | 32 |
| 2010 JG | 2019-Nov-12 | 19.6 LD | 14.9 | 235 |
| 2019 UB14 | 2019-Nov-12 | 4.9 LD | 15.4 | 22 |
| 2019 UH1 | 2019-Nov-13 | 9.5 LD | 9.1 | 50 |
| 2019 UN12 | 2019-Nov-13 | 3.8 LD | 28.8 | 141 |
| 2019 VX | 2019-Nov-13 | 4.1 LD | 10.8 | 31 |
| 2019 UE8 | 2019-Nov-15 | 7.7 LD | 6.6 | 27 |
| 2019 UR2 | 2019-Nov-18 | 18 LD | 13.4 | 126 |
| 2019 UK6 | 2019-Nov-20 | 15.4 LD | 7.7 | 63 |
| 481394 | 2019-Nov-21 | 11.3 LD | 7.9 | 372 |
| 2019 VK | 2019-Nov-21 | 5.8 LD | 7.6 | 43 |
| 2008 EA9 | 2019-Nov-23 | 10.5 LD | 2.2 | 10 |
| 2019 VF1 | 2019-Nov-25 | 13.4 LD | 17.3 | 87 |
| 2017 AP4 | 2019-Dec-03 | 8.5 LD | 7.5 | 15 |
| 2018 XW2 | 2019-Dec-07 | 17.4 LD | 13 | 28 |
| 216258 | 2019-Dec-20 | 15.3 LD | 11.8 | 324 |
| 2013 XY20 | 2019-Dec-21 | 18.4 LD | 1.9 | 28 |
| 2017 XQ60 | 2019-Dec-22 | 11 LD | 15.6 | 47 |
| 310442 | 2019-Dec-26 | 19 LD | 12.3 | 372 |
| 2019 AE3 | 2020-Jan-02 | 4.9 LD | 8.2 | 13 |
Notes: LD means "Lunar Distance." 1 LD = 384,401 km, the distance between Earth and the Moon. 1 LD also equals 0.00256 AU. MAG is the visual magnitude of the asteroid on the date of closest approach. | | Cosmic Rays in the Atmosphere |
SOMETHING NEW! We have developed a new predictive model of aviation radiation. It's called E-RAD--short for Empirical RADiation model. We are constantly flying radiation sensors onboard airplanes over the US and and around the world, so far collecting more than 22,000 gps-tagged radiation measurements. Using this unique dataset, we can predict the dosage on any flight over the USA with an error no worse than 15%.
E-RAD lets us do something new: Every day we monitor approximately 1400 flights criss-crossing the 10 busiest routes in the continental USA. Typically, this includes more than 80,000 passengers per day. E-RAD calculates the radiation exposure for every single flight.
The Hot Flights Table is a daily summary of these calculations. It shows the 5 charter flights with the highest dose rates; the 5 commercial flights with the highest dose rates; 5 commercial flights with near-average dose rates; and the 5 commercial flights with the lowest dose rates. Passengers typically experience dose rates that are 20 to 70 times higher than natural radiation at sea level.
To measure radiation on airplanes, we use the same sensors we fly to the stratosphere onboard Earth to Sky Calculus cosmic ray balloons: neutron bubble chambers and X-ray/gamma-ray Geiger tubes sensitive to energies between 10 keV and 20 MeV. These energies span the range of medical X-ray machines and airport security scanners.
Column definitions: (1) The flight number; (2) The maximum dose rate during the flight, expressed in units of natural radiation at sea level; (3) The maximum altitude of the plane in feet above sea level; (4) Departure city; (5) Arrival city; (6) Duration of the flight.
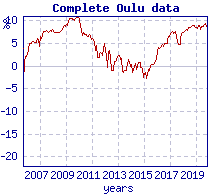
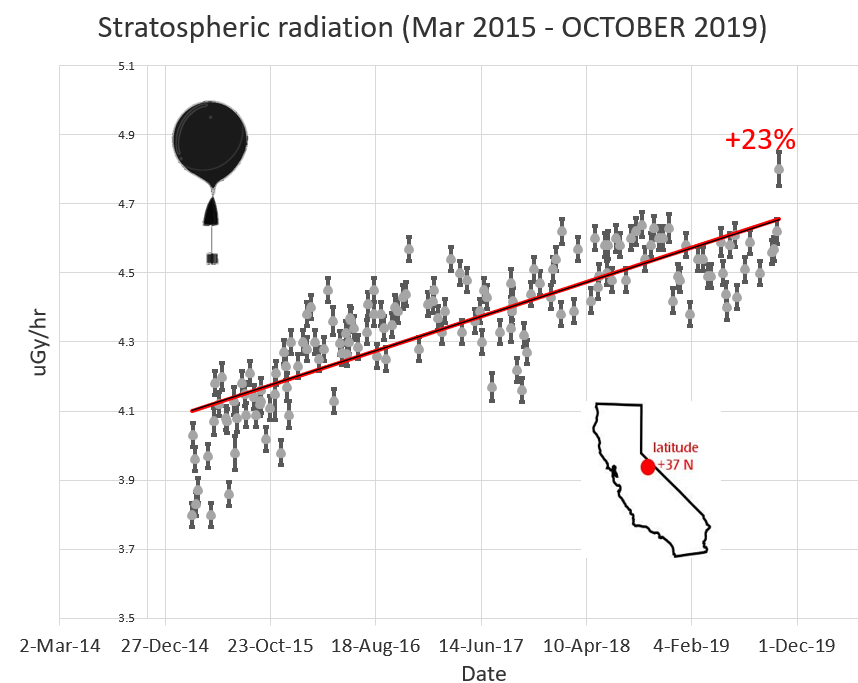
SPACE WEATHER BALLOON DATA: Approximately once a week, Spaceweather.com and the students of Earth to Sky Calculus fly space weather balloons to the stratosphere over California. These balloons are equipped with radiation sensors that detect cosmic rays, a surprisingly "down to Earth" form of space weather. Cosmic rays can seed clouds, trigger lightning, and penetrate commercial airplanes. Furthermore, there are studies ( #1, #2, #3, #4) linking cosmic rays with cardiac arrhythmias and sudden cardiac death in the general population. Our latest measurements show that cosmic rays are intensifying, with an increase of more than 18% since 2015:
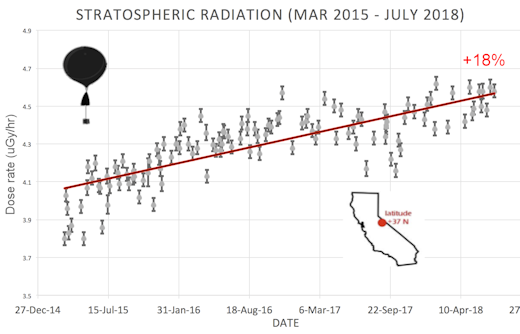
The data points in the graph above correspond to the peak of the Reneger-Pfotzer maximum, which lies about 67,000 feet above central California. When cosmic rays crash into Earth's atmosphere, they produce a spray of secondary particles that is most intense at the entrance to the stratosphere. Physicists Eric Reneger and Georg Pfotzer discovered the maximum using balloons in the 1930s and it is what we are measuring today.
En route to the stratosphere, our sensors also pass through aviation altitudes:
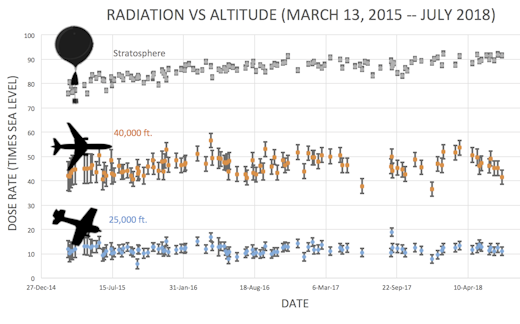
In this plot, dose rates are expessed as multiples of sea level. For instance, we see that boarding a plane that flies at 25,000 feet exposes passengers to dose rates ~10x higher than sea level. At 40,000 feet, the multiplier is closer to 50x.
The radiation sensors onboard our helium balloons detect X-rays and gamma-rays in the energy range 10 keV to 20 MeV. These energies span the range of medical X-ray machines and airport security scanners.
Why are cosmic rays intensifying? The main reason is the sun. Solar storm clouds such as coronal mass ejections (CMEs) sweep aside cosmic rays when they pass by Earth. During Solar Maximum, CMEs are abundant and cosmic rays are held at bay. Now, however, the solar cycle is swinging toward Solar Minimum, allowing cosmic rays to return. Another reason could be the weakening of Earth's magnetic field, which helps protect us from deep-space radiation.
| | The official U.S. government space weather bureau |
| | The first place to look for information about sundogs, pillars, rainbows and related phenomena. |
| | Researchers call it a "Hubble for the sun." SDO is the most advanced solar observatory ever. |
| | 3D views of the sun from NASA's Solar and Terrestrial Relations Observatory |
| | Realtime and archival images of the Sun from SOHO. |
| | from the NOAA Space Environment Center |
| | fun to read, but should be taken with a grain of salt! Forecasts looking ahead more than a few days are often wrong. |
| | from the NOAA Space Environment Center |
| | the underlying science of space weather |
 | To find reviews of new online casino sites in the UK try The Casino DB where there are hundreds of online casino reviews complete with bonuses and ratings. Get a bonus when playing at a new casino in the UK. The Genie got you covered! Looking for a new online casino? Try Casimpo the new site dedicated to making online casino simple and easy for all. |
| | These links help Spaceweather.com stay online. Thank you to our supporters! |
| | | | | | |


