 | | | Switch to: Europe, USA, New Zealand, Antarctica Credit: NOAA/Ovation  Planetary K-index Planetary K-index
Now: Kp= 1.00 quiet
24-hr max: Kp= 2.33 quiet
explanation | more data
Interplanetary Mag. Field
Btotal: 3.67 nT
Bz: -3.50 nT south
more data: ACE, DSCOVR
Updated: Today at 1146 UT Coronal Holes: 04 Jan 24 
Solar wind flowing from this minor coronal hole could graze Earth's magnetic field on Jan. 9th. Credit: SDO/AIA  Polar Stratospheric Clouds
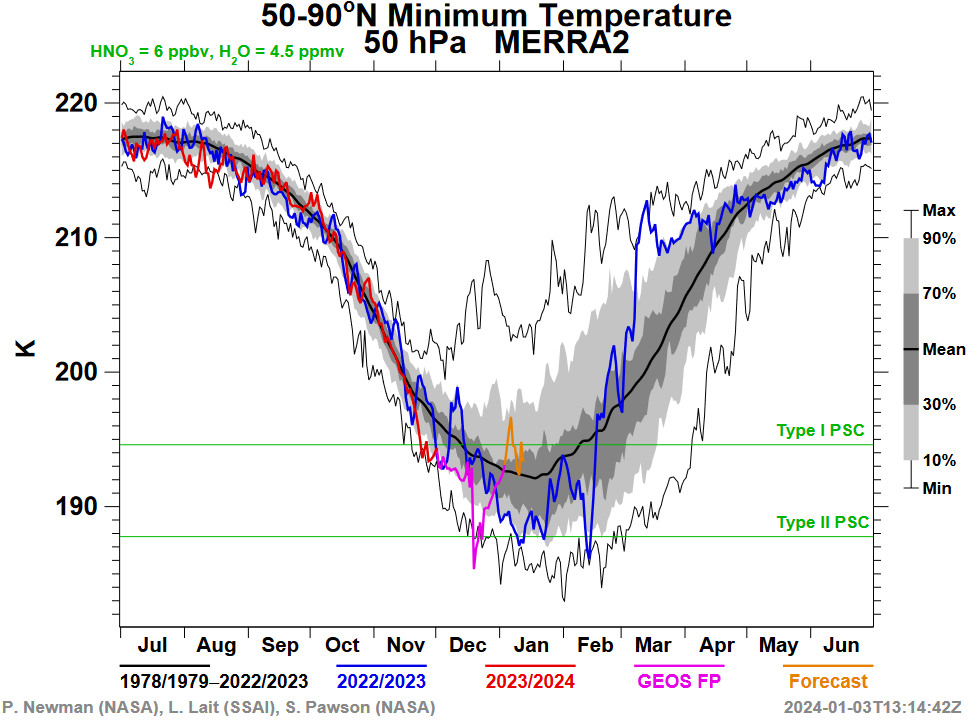
Colorful Type II polar stratospheric clouds (PSC) form when the temperature in the stratosphere drops to a staggeringly low -85C. NASA's MEERA-2 climate model predicts when the air up there is cold enough: 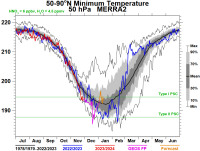
On Jan. 4, 2024, the Arctic stratosphere is too warm for Type II polar stratospheric clouds. | more data. Noctilucent Clouds
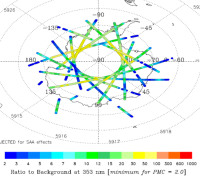
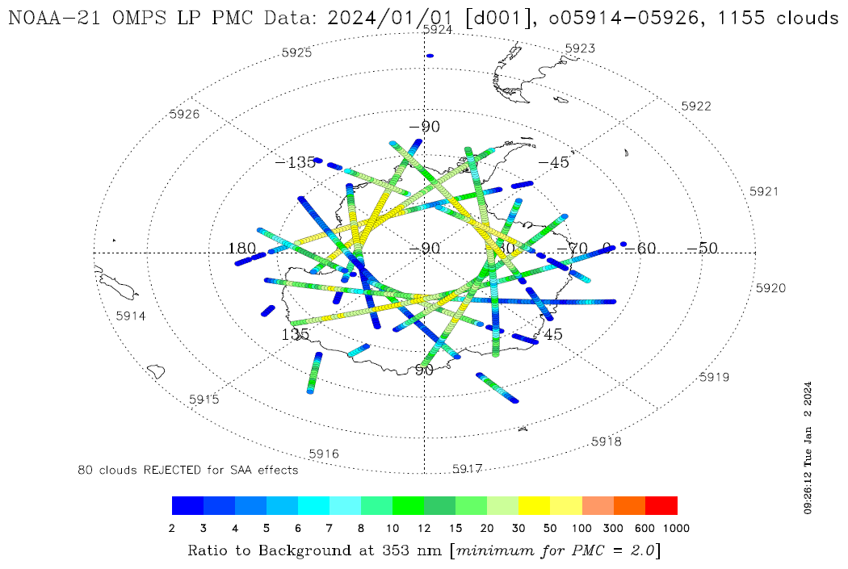
The southern season for NLCs is underway. The first clouds were detected inside the Antarctic Circle on Dec. 4th by the NOAA 21 satellite. An instrument onboard NOAA 21 (OMPS LP) is able to detect NLCs (also known as "polar mesospheric clouds" or PMCs). For the rest of the season, daily maps from NOAA 21 will be presented here:
Updated: Jan 3, 2024
Each dot is a detected cloud. As the season progresses, these dots will multiply in number and shift in hue from blue to red as the brightness of the clouds intensifies.
SPACE WEATHER
NOAA Forecasts | | Updated at: 2024 Jan 04 2200 UTC FLARE | 0-24 hr | 24-48 hr | CLASS M | 40 % | 40 % | CLASS X | 15 % | 15 % | Geomagnetic Storms:
Probabilities for significant disturbances in Earth's magnetic field are given for three activity levels: active, minor storm, severe storm Updated at: 2024 Jan 04 2200 UTC Mid-latitudes | 0-24 hr | 24-48 hr | ACTIVE | 10 % | 10 % | MINOR | 01 % | 01 % | SEVERE | 01 % | 01 % | High latitudes | 0-24 hr | 24-48 hr | ACTIVE | 15 % | 15 % | MINOR | 20 % | 20 % | SEVERE | 15 % | 15 % | | | |  | | | | | | | | | | | This is an AI Free Zone! Text created by ChatGPT and other Large Language Models is spreading rapidly across the Internet. It's well-written, artificial, frequently inaccurate. If you find a mistake on Spaceweather.com, rest assured it was made by a real human being. | | | QUADRANTID METEOR SHOWER: If you see a fireball on Jan. 4th, it's probably a Quadrantid. These meteors come from extinct comet 2003 EH1. Earth is expected to cross the narrow stream of debris between 0900 UT and 1500 UT, producing dozens of meteors per hour. Because the shower's radiant is high in the northern sky, it is a winter shower that few sky watchers see despite its intensity. [sky map] ANOTHER STRONG SOLAR FLARE (UPDATED): Demonstrating its continued potency, sunspot AR3536 produced another strong flare today. The M4-class explosion peaked on Jan. 4th at 0155 UT, and hurled a streamer of plasma into space: 
Extreme ultraviolet radiation from the flare ionized the top of Earth's atmosphere, causing a shortwave radio blackout over Australia and the surrounding Pacific Ocean. Mariners may have noticed loss of signal at frequencies below 20 MHz for more than 30 minutes after the flare's peak. Update: Newly-arriving images from SOHO coronagraphs show no significant Earth-directed CME. This explosion will not be geoeffective. CME impact alerts: SMS Text Realtime Space Weather Photo Gallery
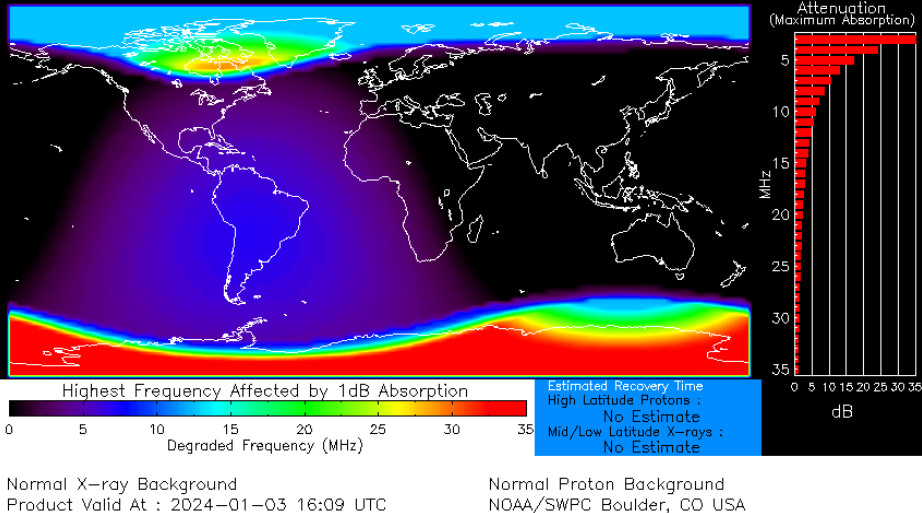
Free: Spaceweather.com Newsletter POLAR CAP ABSORPTION EVENT (UPDATED): The X5-flare that happened on New Year's Eve is still affecting Earth five days later. A polar cap absorption event (PCA) is underway, shown here in a shortwave radio blackout map from NOAA: 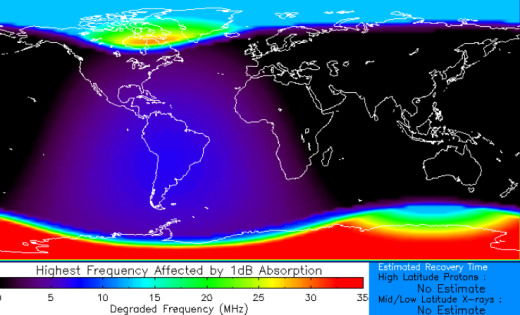
Red zones in this global map show where radio transmissions are being absorbed. Frequencies below 10 MHz are almost completely blacked out, while anything below 35 MHz is being attentuated, at least a little. What's causing this? Protons accelerated by the New Year's Eve explosion (and subsequent lesser flares from the same sunspot) are hitting our planet. Earth's magnetic field funnels these particles toward the poles where their ionizing effect causes the absorption of shortwave radio. This can affect international aviators flying polar routes. The absorption event could last for days; you can can monitor its progress here. Realtime Space Weather Photo Gallery
Free: Spaceweather.com Newsletter SIERRA MOONRISE SPACE PENDANT: Valentine's Day is coming. Are you looking for a far-out gift? Consider the Sierra Moonrise Pendant. It flew to the edge of space onboard a cosmic ray balloon, shown here 117,400 feet above the Sierra Nevada mountains of California: 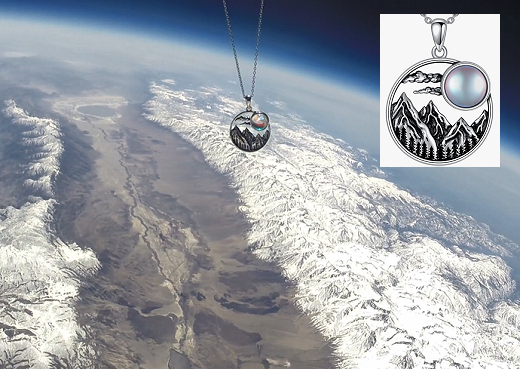
You can have it for $142.95. The sterling silver pendant shows the craggy Sierra range with a full Moonstone rising overhead. It makes a great Valentine's, birthday, or anniversary present. The students of Earth to Sky Calculus are selling space pendants to support their cosmic ray ballooning program. Each one comes with a greeting card showing the pendant in flight and telling the story of its journey to the stratosphere and back again
Far Out Gifts: Earth to Sky Store
All sales support hands-on STEM education
Realtime Aurora Photo Gallery
Free: Spaceweather.com Newsletter
Realtime Comet Photo Gallery
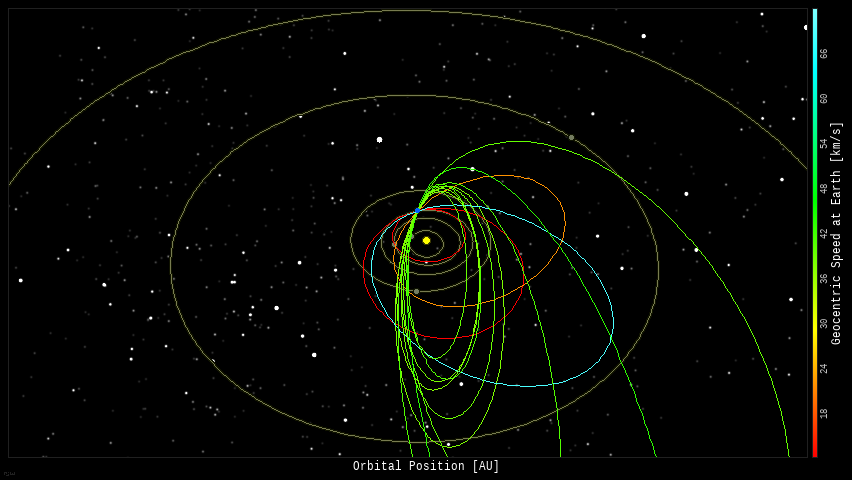
Free: Spaceweather.com Newsletter Every night, a network of NASA all-sky cameras scans the skies above the United States for meteoritic fireballs. Automated software maintained by NASA's Meteoroid Environment Office calculates their orbits, velocity, penetration depth in Earth's atmosphere and many other characteristics. Daily results are presented here on Spaceweather.com. On Jan 04, 2024, the network reported 13 fireballs.
(7 Quadrantids, 6 sporadics) 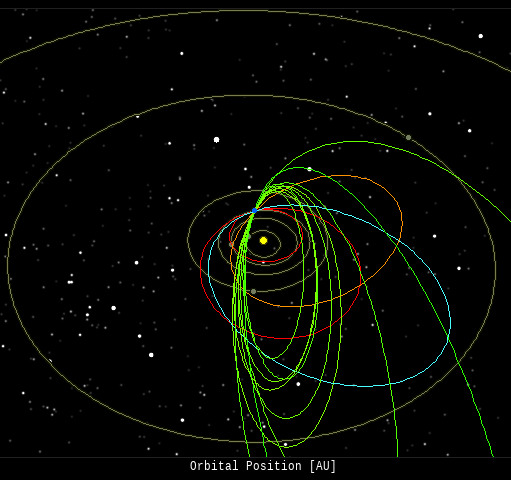 In this diagram of the inner solar system, all of the fireball orbits intersect at a single point--Earth. The orbits are color-coded by velocity, from slow (red) to fast (blue). [Larger image] [movies] Potentially Hazardous Asteroids ( PHAs) are space rocks larger than approximately 100m that can come closer to Earth than 0.05 AU. None of the known PHAs is on a collision course with our planet, although astronomers are finding new ones all the time. On January 4, 2024 there were 2349 potentially hazardous asteroids.
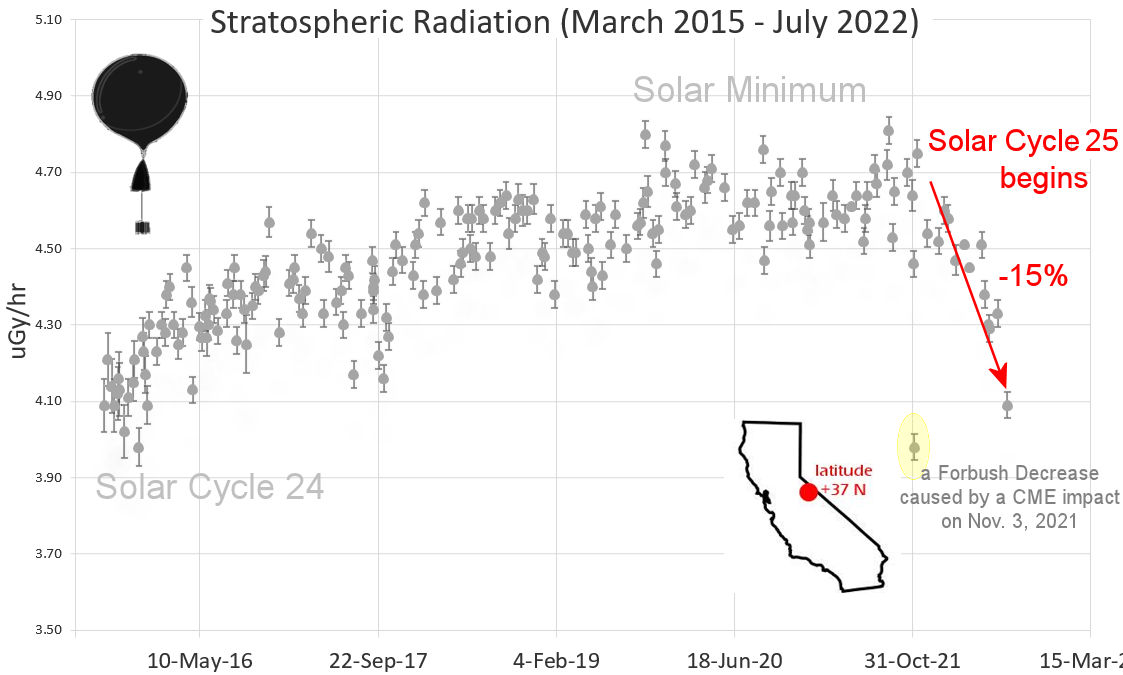
 | Recent & Upcoming Earth-asteroid encounters: | Asteroid | Date(UT) | Miss Distance | Velocity (km/s) | Diameter (m) | | 2023 YM | 2023-Dec-30 | 10.1 LD | 12.4 | 37 | | 2024 AB | 2023-Dec-31 | 1.7 LD | 8.2 | 12 | | 2024 AL | 2023-Dec-31 | 0.9 LD | 12.6 | 10 | | 2023 XE12 | 2023-Dec-31 | 14.7 LD | 11.8 | 42 | | 2021 AM6 | 2023-Dec-31 | 18.3 LD | 6.6 | 17 | | 2023 YR1 | 2024-Jan-01 | 6.5 LD | 13.3 | 27 | | 2023 YY1 | 2024-Jan-01 | 10.6 LD | 6.5 | 27 | | 2023 YR | 2024-Jan-02 | 4.5 LD | 12.2 | 37 | | 2024 AA | 2024-Jan-02 | 1.6 LD | 21.4 | 12 | | 2019 KK5 | 2024-Jan-03 | 10.6 LD | 20.9 | 98 | | 2024 AD | 2024-Jan-04 | 0.6 LD | 9.9 | 6 | | 2023 YX1 | 2024-Jan-06 | 10.1 LD | 14.3 | 39 | | 2024 AC | 2024-Jan-06 | 6 LD | 6.8 | 27 | | 2024 AM | 2024-Jan-07 | 3.2 LD | 9 | 9 | | 2002 AY1 | 2024-Jan-08 | 15.2 LD | 17.3 | 230 | | 2023 XN13 | 2024-Jan-09 | 15.8 LD | 1.4 | 8 | | 2023 XT14 | 2024-Jan-10 | 12.2 LD | 6.4 | 27 | | 2023 YO1 | 2024-Jan-10 | 6.8 LD | 3.1 | 23 | | 2020 AC1 | 2024-Jan-11 | 19.3 LD | 5.3 | 7 | | 2023 WZ3 | 2024-Jan-11 | 16.2 LD | 4 | 35 | | 2021 CZ2 | 2024-Jan-16 | 8 LD | 14.3 | 113 | | 2021 BL3 | 2024-Jan-23 | 17.2 LD | 23.4 | 41 | | 2017 BG92 | 2024-Jan-25 | 11.8 LD | 6.3 | 6 | | 2011 CQ1 | 2024-Jan-26 | 11.3 LD | 4.6 | 1 | | 2007 EG | 2024-Jan-30 | 16 LD | 8.6 | 43 | | 2008 OS7 | 2024-Feb-02 | 7.5 LD | 18.2 | 285 | | 2019 CC5 | 2024-Feb-04 | 19.2 LD | 15 | 139 | | 2023 SP1 | 2024-Feb-07 | 14.3 LD | 11.8 | 256 | | 2020 DK | 2024-Feb-12 | 8.9 LD | 9.9 | 22 | | 2024 AO | 2024-Feb-16 | 9.2 LD | 7.3 | 53 | | 2019 DA1 | 2024-Mar-03 | 14.6 LD | 13.4 | 22 | Notes: LD means "Lunar Distance." 1 LD = 384,401 km, the distance between Earth and the Moon. 1 LD also equals 0.00256 AU. | | Cosmic Rays in the Atmosphere | SPACE WEATHER BALLOON DATA: Almost once a week, Spaceweather.com and the students of Earth to Sky Calculus fly space weather balloons to the stratosphere over California. These balloons are equipped with sensors that detect secondary cosmic rays, a form of radiation from space that can penetrate all the way down to Earth's surface. Our monitoring program has been underway without interruption for 7 years, resulting in a unique dataset of in situ atmospheric measurements. Latest results (July 2022): Atmospheric radiation is decreasing in 2022. Our latest measurements in July 2022 registered a 6-year low: 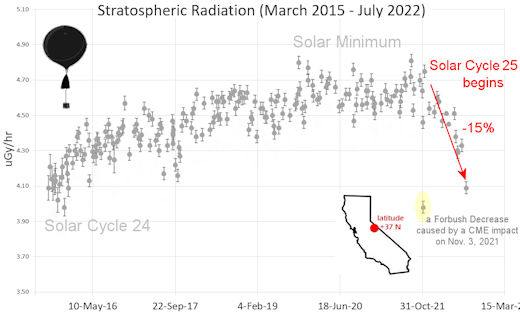
What's going on? Ironically, the radiation drop is caused by increasing solar activity. Solar Cycle 25 has roared to life faster than forecasters expected. The sun's strengthening and increasingly tangled magnetic field repels cosmic rays from deep space. In addition, solar coronal mass ejections (CMEs) sweep aside cosmic rays, causing sharp reductions called "Forbush Decreases." The two effects blend together to bring daily radiation levels down. .Who cares? Cosmic rays are a surprisingly "down to Earth" form of space weather. They can alter the chemistry of the atmosphere, trigger lightning, and penetrate commercial airplanes. According to a study from the Harvard T.H. Chan school of public health, crews of aircraft have higher rates of cancer than the general population. The researchers listed cosmic rays, irregular sleep habits, and chemical contaminants as leading risk factors. A number of controversial studies (#1, #2, #3, #4) go even further, linking cosmic rays with cardiac arrhythmias and sudden cardiac death. Technical notes: The radiation sensors onboard our helium balloons detect X-rays and gamma-rays in the energy range 10 keV to 20 MeV. These energies span the range of medical X-ray machines and airport security scanners. Data points in the graph labeled "Stratospheric Radiation" correspond to the peak of the Regener-Pfotzer maximum, which lies about 67,000 feet above central California. When cosmic rays crash into Earth's atmosphere, they produce a spray of secondary particles that is most intense at the entrance to the stratosphere. Physicists Eric Regener and Georg Pfotzer discovered the maximum using balloons in the 1930s and it is what we are measuring today. | | The official U.S. government space weather bureau | | | The first place to look for information about sundogs, pillars, rainbows and related phenomena. | | | Researchers call it a "Hubble for the sun." SDO is the most advanced solar observatory ever. | | | 3D views of the sun from NASA's Solar and Terrestrial Relations Observatory | | | Realtime and archival images of the Sun from SOHO. | | | information about sunspots based on the latest NOAA/USAF Active Region Summary | | | current counts of failed and deployed Starlink satellites from Jonathan's Space Page | | | Authoritative predictions of space junk and satellite re-entries | | | from the NOAA Space Environment Center | | | fun to read, but should be taken with a grain of salt! Forecasts looking ahead more than a few days are often wrong. | | | from the NOAA Space Environment Center | | | the underlying science of space weather |  | When looking for casinos to play online when the weather is bad, you can try the SkyCity Online Casino if you are located in New Zealand. If you are not from NZ you can try the Swedish page Svenska casino online to find suitable games, check out svenskacasinoonline.net. Always check your local laws before playing with real money.. | | BestCSGOGambling is the best site for everything related to CSGO gambling on the web | | | These links help Spaceweather.com stay online. Thank you to our supporters! | | | | | | | | |  | | |  | ©2021 Spaceweather.com. All rights reserved. This site is penned daily by Dr. Tony Phillips. | |


