Solar minimum is here - but even now strangely beautiful auroras are dancing around the poles. Deep inside the Arctic Circle, the expert guides of Aurora Holidays in Utsjoki, Finland, can help you chase them. Book now! | | |
WEAK CME IMPACT TODAY? A faint slow-moving CME that left the sun on Oct. 26th might hit Earth's magnetic field on Oct. 29th or 30th, according to NOAA forecasters. The impact, if any, would be weak, probably causing polar geomagnetic unrest but not full-fledged storms. Aurora alerts: SMS Text.
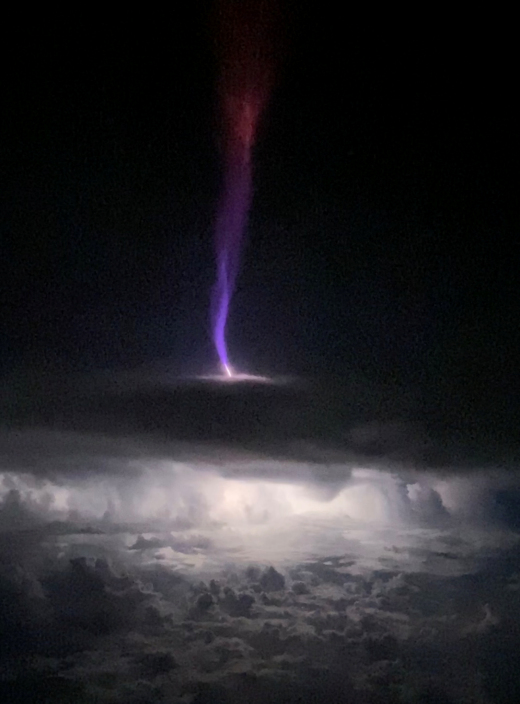
CLOSE ENCOUNTER WITH A GIGANTIC JET: When you see lightning, run! That’s what NOAA advises in lightning safety brochures. On Oct. 15th, however, pilot Chris Holmes had no place to go when lightning started to crackle in thunderstorms around his aircraft.
"I was flying 35,000 feet over the Gulf of Mexico near the Yucatan Peninsula when a super cell started pulsing with light," he says. "It wasn't just ordinary lightning, though. The cell was creating lots of sprites and jets leaping up from the thunderhead." At a distance of only 35 miles, he video-recorded this:
"It was the most amazing thing I've seen in my aviation career," he says.
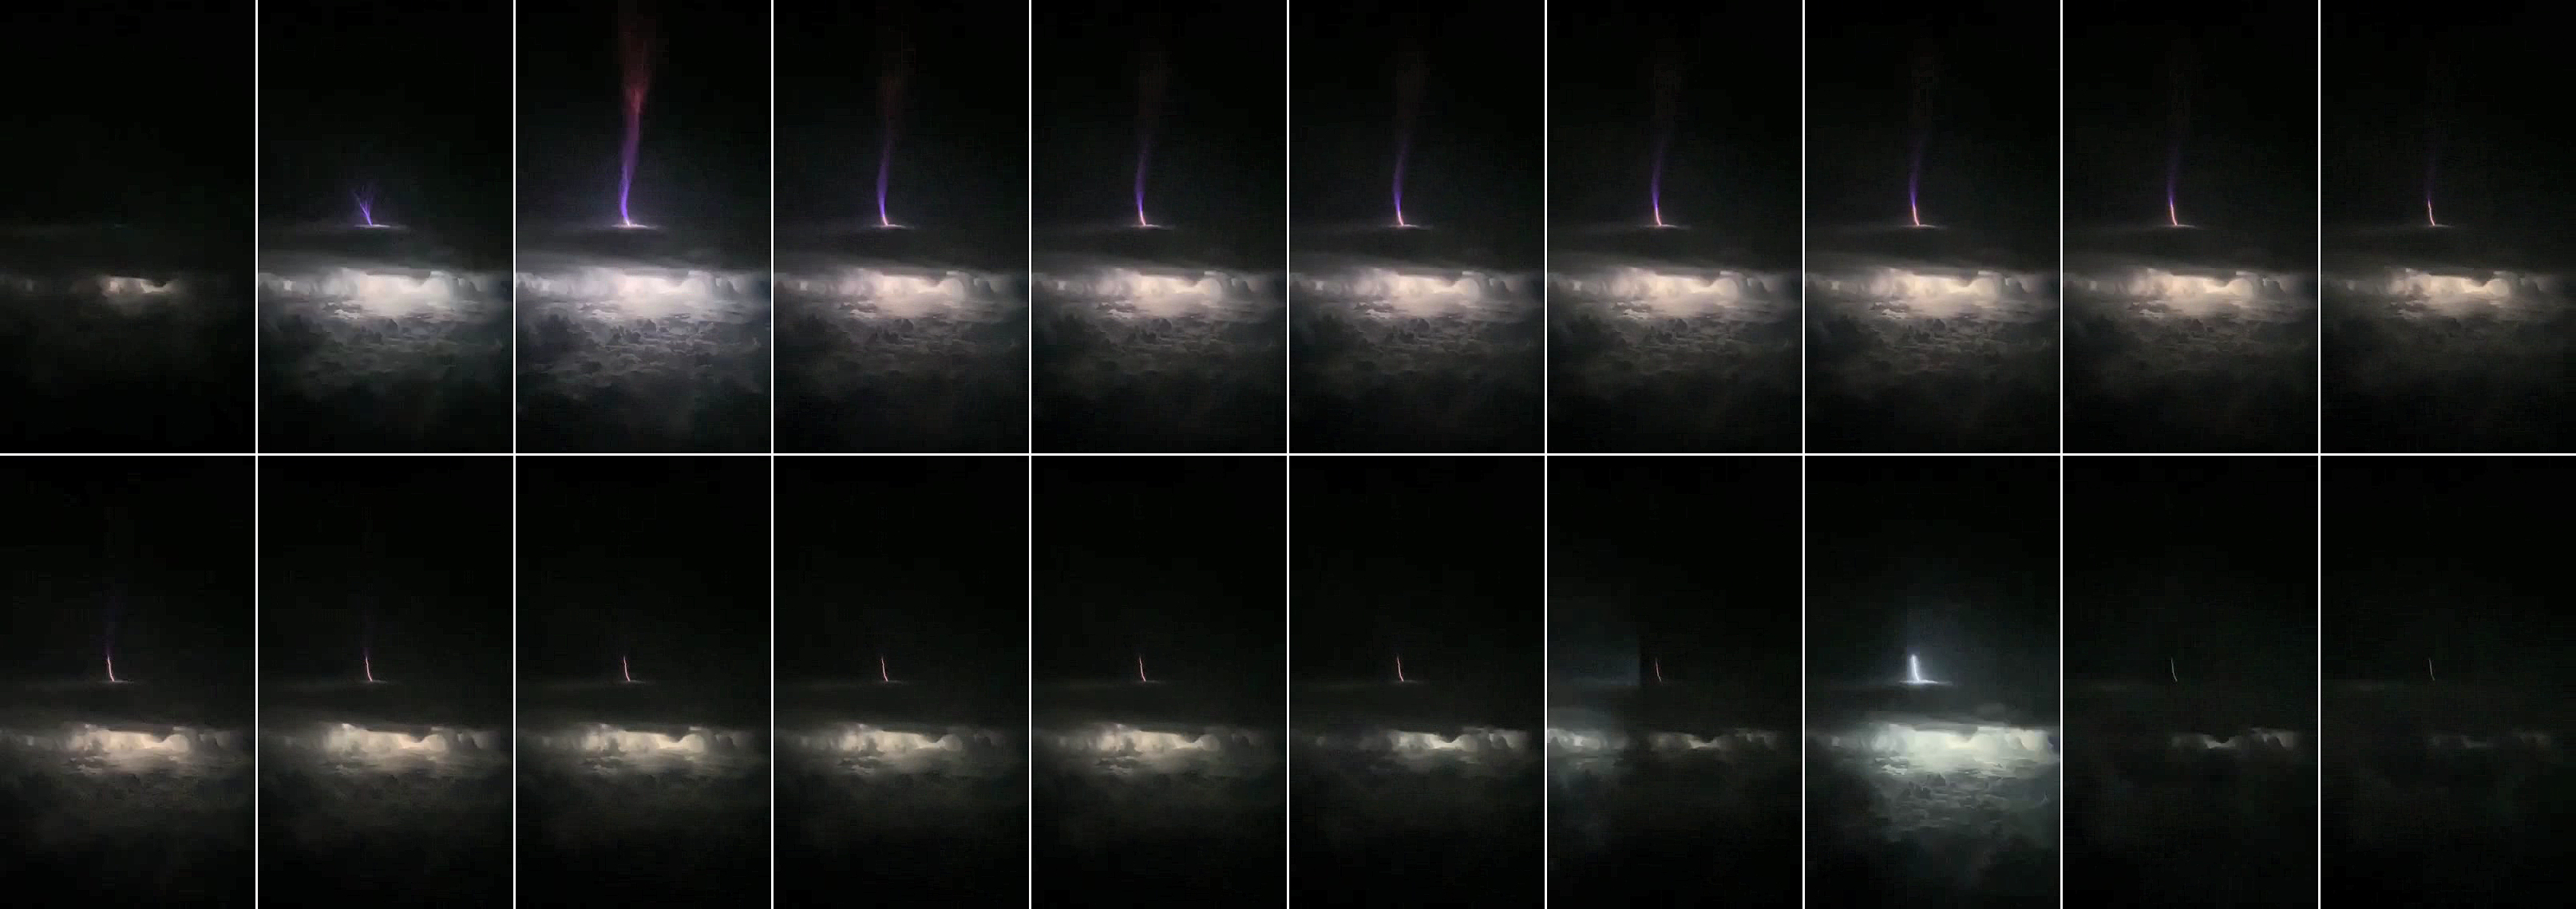
Holmes had a close encounter with a Gigantic Jet. Sometimes called "Earth’s tallest lightning," because they reach all the way to the ionosphere ~50 miles high, the towering forms were discovered near Taiwan and Puerto Rico in 2001-2002. Since then, only dozens of Gigantic Jets have been photographed. In previous images taken by cameras on the ground, it's almost always impossible to see the base of the jet over the edge of the thundercloud. That’s why Holmes’s video is special. He was filming above the storm at practically point-blank range.
"His clip shows very nicely the top of the cloud where the jet emerges, which is usually hidden from view," says Oscar van der Velde of the Lightning Research Group at the Universitat Politècnica de Catalunya who examined the footage. "I split the video into individual frames so we can see exactly what happens."
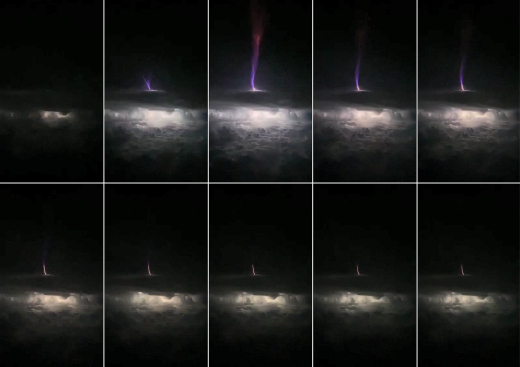
Van der Velde’s deconstruction reveals the order of events: “First, relatively cool blue filaments spring up. These are streamers akin to Saint Elmo’s Fire,” he explains. “Next, after the Jet reaches its maximum height, another feature crawls more slowly out of the cloudtop–a white-hot ‘lightning leader.'”
Turns out, this is a bit of a surprise. For years, some researchers thought that Gigantic Jets could reach such extreme heights only if their streamers got a boost from the lightning leader. Holmes’s video shows just the opposite: The Gigantic Jet reaches the ionosphere before the lightning leader even leaves the cloud.
“This suggests that there may be a much more powerful electric configuration inside the thunderstorm than was previously thought–perhaps as much as 200 million volts," says van der Velde.
It just goes to show, we still have a lot to learn about Gigantic Jets. A sharable version of this story is available here.
Realtime Sprite Photo Gallery
Free: Spaceweather.com Newsletter
THE TAIL OF INTERSTELLAR COMET BORISOV: Interstellar comet 2I/Borisov is coming closer to Earth, giving astronomers a better view of its growing tail. Michael Jäger of Weißenkirchen, Austria took his best picture yet on Oct. 26th, with the tadpole-like comet racing past brilliant Regulus, a strangely-shaped internal lens reflection of Regulus, and multiple satellites:
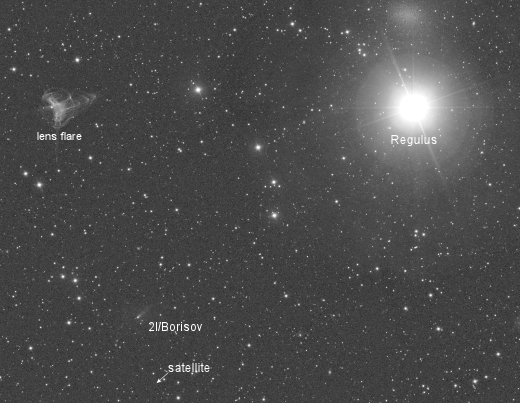
"I created this image by stacking 38 one hundred second exposures from an 8-inch telescope," says Jäger. "Such long exposure times are required to see this very faint comet."
Jäger says the comet's tail is about 5 arc minutes long. That means it stretches ~540,000 km--more than the distance from Earth to the Moon and almost four times the width of the planet Jupiter. We will get an even better view in the months ahead as the distance to the comet shrinks from 2.5 AU now to 1.9 AU in late December. Stay tuned.
Realtime Comet Photo Gallery
Free: Spaceweather.com Newsletter
THE SUNFLOWER SPACE PENDANT: Are you looking for a far-out gift? Consider the sunflower space pendant. On Oct. 18, 2019, the students of Earth to Sky Calculus launched a cosmic ray balloon to the stratosphere. This cheerful pendant went along for the ride, 109,923 feet high:
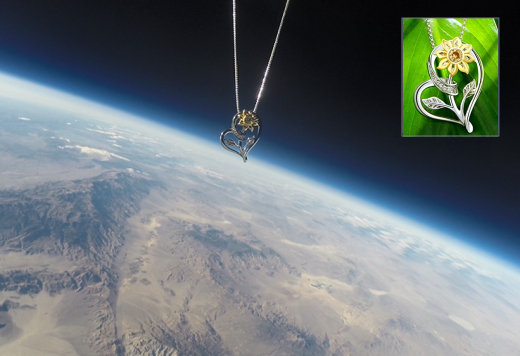
You can have it for $109.92 (its altitude divided by 1000). The students are selling these pendants to support their cosmic ray ballooning program. Each rose gold-plated pendant comes with a greeting card showing the flower in flight and telling the story of its journey to the edge of space and back again. They make great birthday, anniversary and Christmas gifts.
Far Out Gifts: Earth to Sky Store
All sales support hands-on STEM education
Realtime Spaceweather Photo Gallery
Free: Spaceweather.com Newsletter
Realtime Aurora Photo Gallery
Free: Spaceweather.com Newsletter
Every night, a network of
NASA all-sky cameras scans the skies above the United States for meteoritic fireballs. Automated software maintained by NASA's Meteoroid Environment Office calculates their orbits, velocity, penetration depth in Earth's atmosphere and many other characteristics. Daily results are presented here on Spaceweather.com.
On Oct. 29, 2019, the network reported 54 fireballs.
(38 sporadics, 9 Orionids, 4 southern Taurids, 2 epsilon Geminids, 1 chi Taurid)
In this diagram of the inner solar system, all of the fireball orbits intersect at a single point--Earth. The orbits are color-coded by velocity, from slow (red) to fast (blue). [Larger image] [movies]
Potentially Hazardous Asteroids (
PHAs) are space rocks larger than approximately 100m that can come closer to Earth than 0.05 AU. None of the known PHAs is on a collision course with our planet, although astronomers are finding
new ones all the time.
On October 29, 2019 there were 2018 potentially hazardous asteroids.
 |
Recent & Upcoming Earth-asteroid encounters: | Asteroid | Date(UT) | Miss Distance | Velocity (km/s) | Diameter (m) |
| 2019 UH | 2019-Oct-24 | 5 LD | 13.2 | 26 |
| 2019 UW7 | 2019-Oct-24 | 3.3 LD | 10.2 | 12 |
| 2019 UD | 2019-Oct-24 | 8.6 LD | 3.1 | 14 |
| 2019 UD3 | 2019-Oct-24 | 4 LD | 12 | 25 |
| 2019 UA2 | 2019-Oct-25 | 9.3 LD | 8.8 | 15 |
| 2019 UW6 | 2019-Oct-25 | 9.7 LD | 11.3 | 17 |
| 2019 TQ2 | 2019-Oct-25 | 12.8 LD | 12.4 | 36 |
| 2019 UQ | 2019-Oct-25 | 4.3 LD | 12.9 | 20 |
| 2019 UO8 | 2019-Oct-25 | 0.4 LD | 25.3 | 5 |
| 162082 | 2019-Oct-25 | 16.2 LD | 11.2 | 589 |
| 2017 TG5 | 2019-Oct-25 | 14.4 LD | 11.9 | 34 |
| 2019 UT7 | 2019-Oct-25 | 3.4 LD | 9.9 | 16 |
| 2019 UB6 | 2019-Oct-25 | 1.7 LD | 8 | 8 |
| 2019 UO5 | 2019-Oct-26 | 19.2 LD | 10.5 | 27 |
| 2019 UD2 | 2019-Oct-26 | 12.2 LD | 7.7 | 17 |
| 2016 TH94 | 2019-Oct-26 | 11 LD | 14 | 42 |
| 2019 UU5 | 2019-Oct-26 | 15.2 LD | 7.2 | 31 |
| 2019 UY7 | 2019-Oct-27 | 1.4 LD | 10.8 | 12 |
| 2019 UC2 | 2019-Oct-27 | 16.6 LD | 6.7 | 15 |
| 2019 UJ6 | 2019-Oct-27 | 4.1 LD | 7.7 | 21 |
| 2019 UD7 | 2019-Oct-27 | 1.9 LD | 13.5 | 9 |
| 2019 UM9 | 2019-Oct-28 | 3.2 LD | 7.6 | 12 |
| 2019 UT1 | 2019-Oct-28 | 4.7 LD | 8.8 | 11 |
| 2019 UE1 | 2019-Oct-28 | 8.6 LD | 6.8 | 24 |
| 2019 UC | 2019-Oct-29 | 2.9 LD | 8.9 | 51 |
| 2019 TR2 | 2019-Oct-29 | 19.4 LD | 13.8 | 75 |
| 2019 UB8 | 2019-Oct-29 | 0.5 LD | 10.6 | 6 |
| 2019 UL5 | 2019-Oct-29 | 3.9 LD | 5.3 | 11 |
| 2019 UT8 | 2019-Oct-29 | 2.8 LD | 15.7 | 13 |
| 2019 UB2 | 2019-Oct-29 | 15.2 LD | 8.4 | 24 |
| 2019 UH7 | 2019-Oct-30 | 10 LD | 6.2 | 10 |
| 2019 UM8 | 2019-Oct-30 | 5.9 LD | 7 | 7 |
| 2019 UJ3 | 2019-Oct-31 | 7.3 LD | 8.6 | 23 |
| 2019 UF9 | 2019-Oct-31 | 2 LD | 10.3 | 8 |
| 2019 UP7 | 2019-Nov-01 | 15.4 LD | 9.4 | 24 |
| 2019 UM4 | 2019-Nov-01 | 11.1 LD | 9.2 | 22 |
| 2019 UU3 | 2019-Nov-02 | 13.3 LD | 13.8 | 28 |
| 2015 JD1 | 2019-Nov-03 | 12.9 LD | 11.9 | 269 |
| 2019 UL8 | 2019-Nov-03 | 2.8 LD | 12.8 | 19 |
| 2019 UH3 | 2019-Nov-03 | 10.4 LD | 8.5 | 24 |
| 2019 UH5 | 2019-Nov-05 | 13.4 LD | 3.5 | 12 |
| 2019 UL4 | 2019-Nov-07 | 16.6 LD | 9 | 29 |
| 2019 UO7 | 2019-Nov-07 | 3.8 LD | 4.1 | 10 |
| 2019 UR4 | 2019-Nov-08 | 7.4 LD | 4.5 | 15 |
| 2019 UB7 | 2019-Nov-10 | 13.7 LD | 17.5 | 53 |
| 2010 JG | 2019-Nov-12 | 19.6 LD | 14.9 | 235 |
| 2019 UH1 | 2019-Nov-13 | 9.5 LD | 9.1 | 50 |
| 2019 UE8 | 2019-Nov-15 | 7.7 LD | 6.6 | 26 |
| 2019 UR2 | 2019-Nov-18 | 18 LD | 13.4 | 122 |
| 2019 UK6 | 2019-Nov-20 | 15.4 LD | 7.7 | 63 |
| 481394 | 2019-Nov-21 | 11.3 LD | 7.9 | 372 |
| 2008 EA9 | 2019-Nov-23 | 10.5 LD | 2.2 | 10 |
| 2017 AP4 | 2019-Dec-03 | 8.5 LD | 7.5 | 15 |
| 2018 XW2 | 2019-Dec-07 | 17.4 LD | 13 | 28 |
| 216258 | 2019-Dec-20 | 15.3 LD | 11.8 | 324 |
| 2013 XY20 | 2019-Dec-21 | 18.4 LD | 1.9 | 28 |
| 2017 XQ60 | 2019-Dec-22 | 11 LD | 15.6 | 47 |
| 310442 | 2019-Dec-26 | 19 LD | 12.3 | 372 |
Notes: LD means "Lunar Distance." 1 LD = 384,401 km, the distance between Earth and the Moon. 1 LD also equals 0.00256 AU. MAG is the visual magnitude of the asteroid on the date of closest approach. | | Cosmic Rays in the Atmosphere |
SOMETHING NEW! We have developed a new predictive model of aviation radiation. It's called E-RAD--short for Empirical RADiation model. We are constantly flying radiation sensors onboard airplanes over the US and and around the world, so far collecting more than 22,000 gps-tagged radiation measurements. Using this unique dataset, we can predict the dosage on any flight over the USA with an error no worse than 15%.
E-RAD lets us do something new: Every day we monitor approximately 1400 flights criss-crossing the 10 busiest routes in the continental USA. Typically, this includes more than 80,000 passengers per day. E-RAD calculates the radiation exposure for every single flight.
The Hot Flights Table is a daily summary of these calculations. It shows the 5 charter flights with the highest dose rates; the 5 commercial flights with the highest dose rates; 5 commercial flights with near-average dose rates; and the 5 commercial flights with the lowest dose rates. Passengers typically experience dose rates that are 20 to 70 times higher than natural radiation at sea level.
To measure radiation on airplanes, we use the same sensors we fly to the stratosphere onboard Earth to Sky Calculus cosmic ray balloons: neutron bubble chambers and X-ray/gamma-ray Geiger tubes sensitive to energies between 10 keV and 20 MeV. These energies span the range of medical X-ray machines and airport security scanners.
Column definitions: (1) The flight number; (2) The maximum dose rate during the flight, expressed in units of natural radiation at sea level; (3) The maximum altitude of the plane in feet above sea level; (4) Departure city; (5) Arrival city; (6) Duration of the flight.
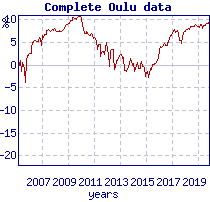
SPACE WEATHER BALLOON DATA: Approximately once a week, Spaceweather.com and the students of Earth to Sky Calculus fly space weather balloons to the stratosphere over California. These balloons are equipped with radiation sensors that detect cosmic rays, a surprisingly "down to Earth" form of space weather. Cosmic rays can seed clouds, trigger lightning, and penetrate commercial airplanes. Furthermore, there are studies ( #1, #2, #3, #4) linking cosmic rays with cardiac arrhythmias and sudden cardiac death in the general population. Our latest measurements show that cosmic rays are intensifying, with an increase of more than 18% since 2015:
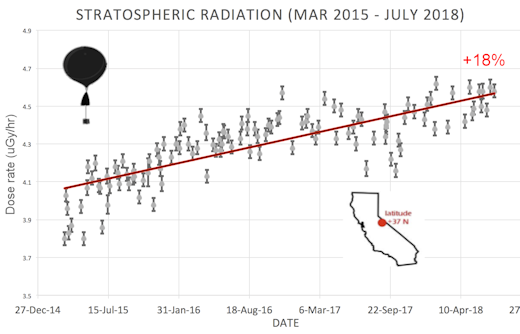
The data points in the graph above correspond to the peak of the Reneger-Pfotzer maximum, which lies about 67,000 feet above central California. When cosmic rays crash into Earth's atmosphere, they produce a spray of secondary particles that is most intense at the entrance to the stratosphere. Physicists Eric Reneger and Georg Pfotzer discovered the maximum using balloons in the 1930s and it is what we are measuring today.
En route to the stratosphere, our sensors also pass through aviation altitudes:
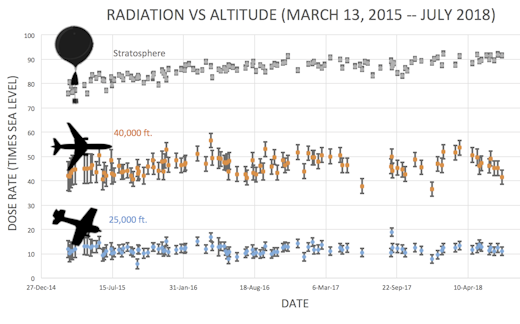
In this plot, dose rates are expessed as multiples of sea level. For instance, we see that boarding a plane that flies at 25,000 feet exposes passengers to dose rates ~10x higher than sea level. At 40,000 feet, the multiplier is closer to 50x.
The radiation sensors onboard our helium balloons detect X-rays and gamma-rays in the energy range 10 keV to 20 MeV. These energies span the range of medical X-ray machines and airport security scanners.
Why are cosmic rays intensifying? The main reason is the sun. Solar storm clouds such as coronal mass ejections (CMEs) sweep aside cosmic rays when they pass by Earth. During Solar Maximum, CMEs are abundant and cosmic rays are held at bay. Now, however, the solar cycle is swinging toward Solar Minimum, allowing cosmic rays to return. Another reason could be the weakening of Earth's magnetic field, which helps protect us from deep-space radiation.
| | The official U.S. government space weather bureau |
| | The first place to look for information about sundogs, pillars, rainbows and related phenomena. |
| | Researchers call it a "Hubble for the sun." SDO is the most advanced solar observatory ever. |
| | 3D views of the sun from NASA's Solar and Terrestrial Relations Observatory |
| | Realtime and archival images of the Sun from SOHO. |
| | from the NOAA Space Environment Center |
| | fun to read, but should be taken with a grain of salt! Forecasts looking ahead more than a few days are often wrong. |
| | from the NOAA Space Environment Center |
| | the underlying science of space weather |
 | To find reviews of new online casino sites in the UK try The Casino DB where there are hundreds of online casino reviews complete with bonuses and ratings. Looking for a new online casino? Try Casimpo the new site dedicated to making online casino simple and easy for all. |
| | These links help Spaceweather.com stay online. Thank you to our supporters! |
| | | | | | |


