Marianne’s Arctic tours: Operating in small groups of 7 to 14 persons--all needs supplied for safety, comfort and pleasure. Night & day photography or non-photographic landscape - wildlife tours. Click for details! | | |
COMING SOON: THE GEMINID METEOR SHOWER: Earth is approaching a stream of gravelly debris from "rock comet" 3200 Phaethon, source of the annual Geminid meteor shower. Forecasters expect the shower to peak on Dec. 13-14, right on the heels of a glaring full Moon (Dec. 12). Fortunately, Geminids are rich in fireballs and many of them may be seen in spite of lunar interference. Stay tuned for updates as peak-night approaches.
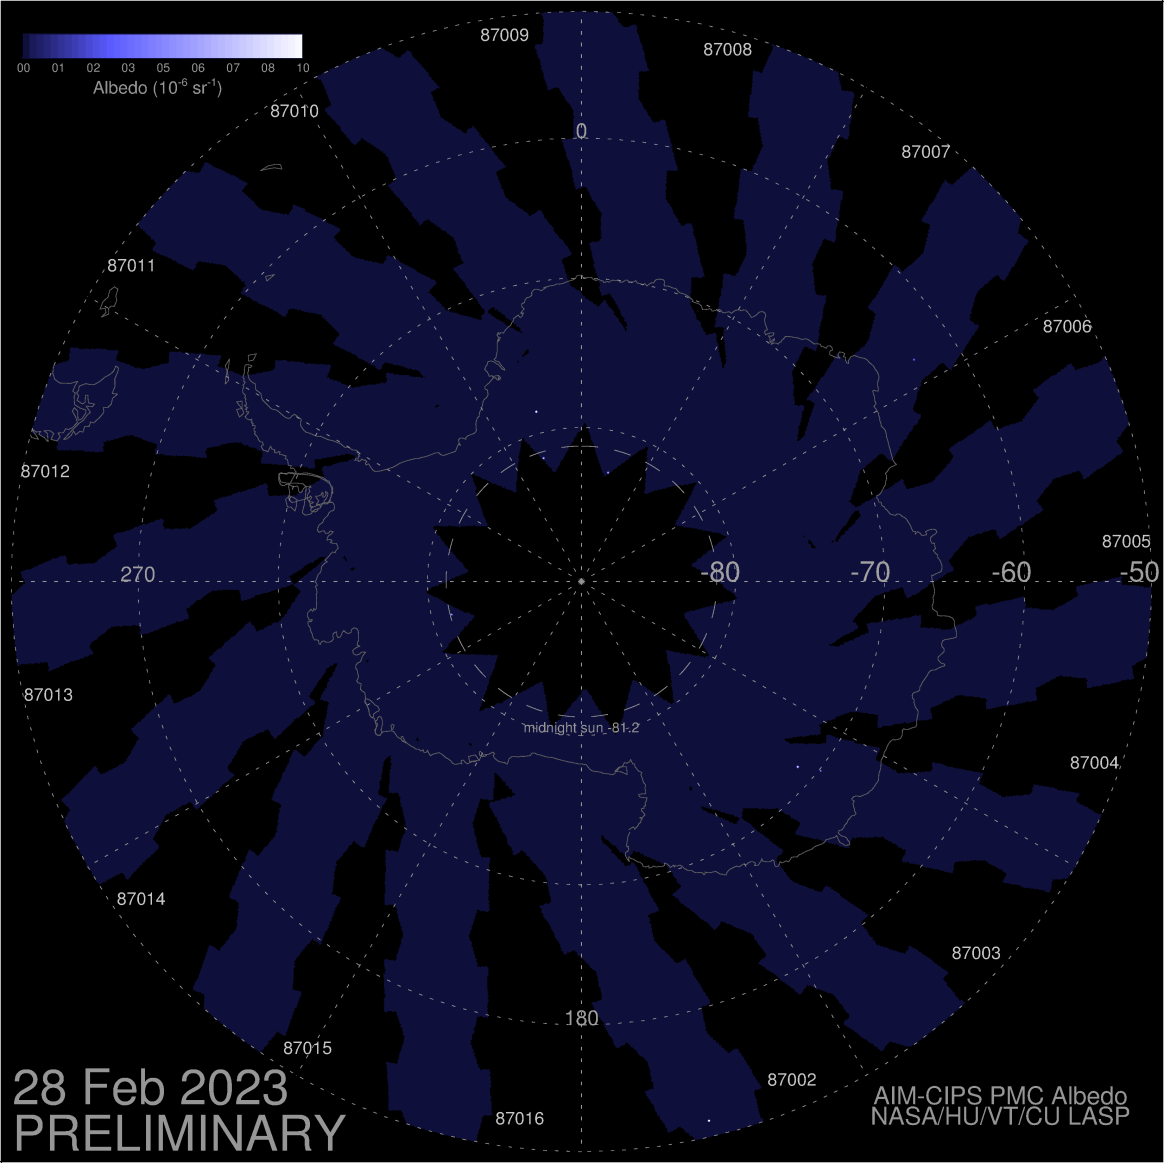
PLANETARY WAVE SUPERCHARGES NOCTILUCENT CLOUDS: An atmospheric wave nearly half as wide as Earth itself is supercharging noctilucent clouds (NLCs) in the southern hemisphere. NASA's AIM spacecraft detected the phenomenon in this series of south polar images spanning Nov. 27th through Dec. 2nd:
“This is a clear sign of planetary wave activity,” says AIM principal investigator James Russell of Hampton University, which manages the Aeronomy of Ice in the Mesosphere mission for NASA.
Planetary waves are enormous ripples of temperature and pressure that form in Earth’s atmosphere in response to Coriolis forces. In this case, a 5-day planetary wave is boosting noctilucent clouds over Antarctica and causing them to spin outward to latitudes where NLCs are rarely seen.
On Dec. 1st, Mirko Harnisch saw the clouds from Dunedin, New Zealand:
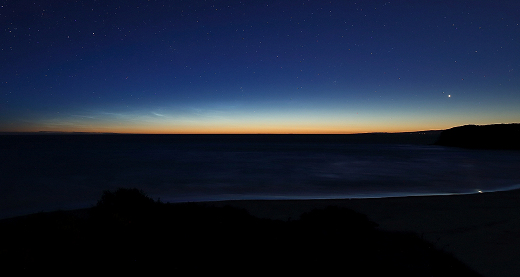
"I was enjoying the late-evening sky over the Southern Ocean just after 11 pm local time when these wispy blue-ish noctilucent clouds appeared," says Harnisch. "This a rare sighting for my latitude of 45S."
Indeed, it is very rare. Spaceweather.com has been receiving images of NLCs for more than 20 years. This is the first-ever submission from New Zealand or any other mid-latitude site in the southern hemisphere.
Noctilucent clouds over Antarctica are nothing unusual. They form every year around this time when the first wisps of summertime water vapor rise to the top of Earth’s atmosphere. Molecules of H2O adhere to specks of meteor smoke, forming ice crystals 83 km above Earth’s surface.
But these NLCs are different. They’re unusually strong and congregated in a coherent spinning mass.
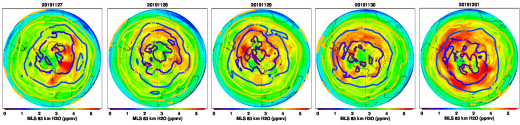
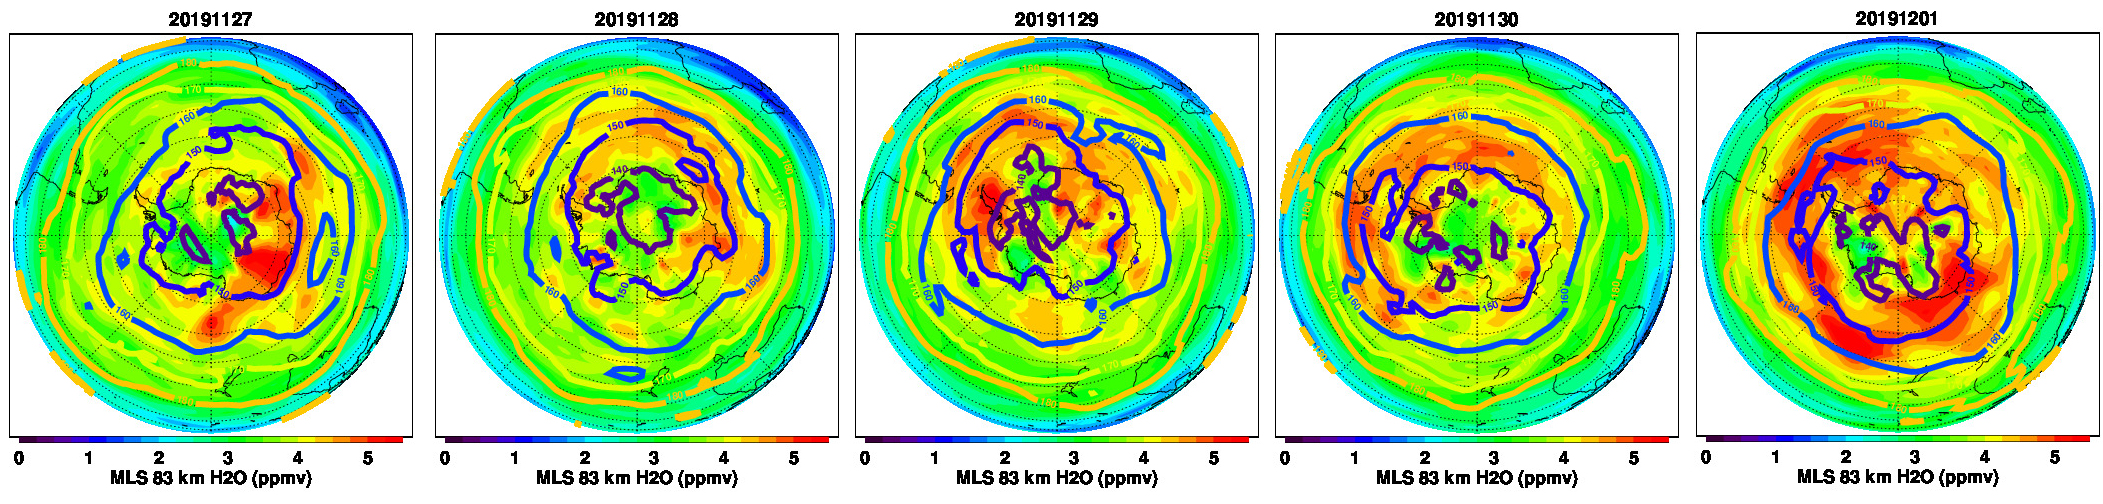
Above: Temperature and water vapor data from NASA Microwave Limb Sounder, Nov. 27- Dec. 1, 2019
"The planetary wave is responsible," explains AIM science team member Lynn Harvey of the University of Colorado's Laboratory for Atmospheric and Space Physics (LASP). "It is concentrating a mass of cold water vapor in the mesosphere and causing the moisture to pinwheel counterclockwise around the South Pole." Harvey has been tracking the moisture in data from NASA’s Microwave Limb Sounder instruments, shown above. It matches almost perfectly the location of the NLCs.
Because the noctilucent clouds are spinning around with a 5 day period, they could return to New Zealand 5 days after Harnisch saw them–that is, on Dec. 6th. Such a forecast is very uncertain. Nevertheless, sky watchers who wish to try should look west 30 to 60 minutes after sunset. If you see luminous blue-white tendrils hugging the horizon, you may have spotted a noctilucent cloud.
A sharable version of this story is available here.
Realtime Spaceweather Photo Gallery
Free: Spaceweather.com Newsletter
THE SHOOTING STAR SPACE PENDANT: It's simple. It's elegant. And it's been to the edge of space. On Sept. 27th, the students of Earth to Sky Calculus launched a cosmic ray balloon to the stratosphere. This stainless steel "shooting star" pendant hitched a ride, all the way to 108,245 feet:
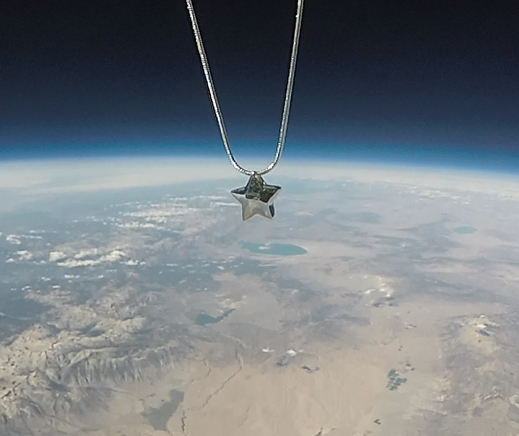
You can have it for $119.95. The students are selling shooting star pendants to support their cosmic ray ballooning program. Each one comes with greeting card showing the item in flight and telling the story of its journey to the edge of space and back again. These make great birthday and Christmas gifts.
Bonus: The star contains a hidden chamber, which you may fill with the ashes of a loved one or anything else you wish to keep close to your heart.
Far Out Gifts: Earth to Sky Store
All sales support hands-on STEM education
Realtime Aurora Photo Gallery
Free: Spaceweather.com Newsletter
Every night, a network of
NASA all-sky cameras scans the skies above the United States for meteoritic fireballs. Automated software maintained by NASA's Meteoroid Environment Office calculates their orbits, velocity, penetration depth in Earth's atmosphere and many other characteristics. Daily results are presented here on Spaceweather.com.
On Dec. 05, 2019, the network reported 24 fireballs.
(15 sporadics, 5 sigma Hydrids, 2 Nov. omega Orionids, 1 Geminid, 1 Puppid-Velid)
In this diagram of the inner solar system, all of the fireball orbits intersect at a single point--Earth. The orbits are color-coded by velocity, from slow (red) to fast (blue). [Larger image] [movies]
Potentially Hazardous Asteroids (
PHAs) are space rocks larger than approximately 100m that can come closer to Earth than 0.05 AU. None of the known PHAs is on a collision course with our planet, although astronomers are finding
new ones all the time.
On December 5, 2019 there were 2018 potentially hazardous asteroids.
 |
Recent & Upcoming Earth-asteroid encounters: | Asteroid | Date(UT) | Miss Distance | Velocity (km/s) | Diameter (m) |
| 2019 XM | 2019-Nov-30 | 5.2 LD | 12.3 | 9 |
| 2019 WQ3 | 2019-Nov-30 | 9.7 LD | 17.9 | 85 |
| 2019 WL3 | 2019-Nov-30 | 17.1 LD | 10.8 | 29 |
| 2019 WJ4 | 2019-Nov-30 | 0.9 LD | 18.5 | 7 |
| 2019 XO | 2019-Dec-01 | 11.6 LD | 8.5 | 13 |
| 2019 WH2 | 2019-Dec-01 | 3.4 LD | 10.2 | 16 |
| 2019 WD3 | 2019-Dec-01 | 12.6 LD | 8.3 | 33 |
| 2019 WN1 | 2019-Dec-01 | 4.3 LD | 10.1 | 18 |
| 2019 WH4 | 2019-Dec-02 | 5.8 LD | 8.1 | 12 |
| 2017 AP4 | 2019-Dec-03 | 8.5 LD | 7.5 | 15 |
| 2019 WW | 2019-Dec-05 | 8.6 LD | 9.8 | 44 |
| 2019 WB5 | 2019-Dec-06 | 18.7 LD | 22 | 48 |
| 2019 XN | 2019-Dec-06 | 2.4 LD | 9.7 | 11 |
| 2019 WR3 | 2019-Dec-06 | 14.2 LD | 7.5 | 97 |
| 2019 WJ6 | 2019-Dec-07 | 7.5 LD | 21.1 | 47 |
| 2019 XP | 2019-Dec-07 | 5.5 LD | 12.1 | 16 |
| 2018 XW2 | 2019-Dec-07 | 17.4 LD | 13 | 28 |
| 2019 VH5 | 2019-Dec-08 | 18 LD | 9.8 | 74 |
| 2019 XY | 2019-Dec-09 | 3.2 LD | 13.1 | 9 |
| 2019 XB | 2019-Dec-09 | 17.4 LD | 7.9 | 66 |
| 2019 WT3 | 2019-Dec-09 | 9.8 LD | 11 | 40 |
| 2019 WO2 | 2019-Dec-09 | 4.8 LD | 7.6 | 34 |
| 2019 XW | 2019-Dec-10 | 10.8 LD | 15.6 | 60 |
| 2019 WP6 | 2019-Dec-14 | 6.4 LD | 4.4 | 22 |
| 2019 XF | 2019-Dec-18 | 9.5 LD | 24.4 | 78 |
| 216258 | 2019-Dec-20 | 15.3 LD | 11.8 | 324 |
| 2013 XY20 | 2019-Dec-21 | 18.3 LD | 1.9 | 28 |
| 2017 XQ60 | 2019-Dec-22 | 11 LD | 15.6 | 47 |
| 310442 | 2019-Dec-26 | 19 LD | 12.3 | 372 |
| 2019 WR4 | 2019-Dec-31 | 11.7 LD | 4.3 | 21 |
| 2019 AE3 | 2020-Jan-02 | 4.9 LD | 8.2 | 13 |
| 2019 UO | 2020-Jan-10 | 11.8 LD | 9.4 | 359 |
| 2019 WC5 | 2020-Jan-11 | 6.4 LD | 13 | 112 |
| 2011 EP51 | 2020-Jan-15 | 19.6 LD | 7.1 | 32 |
| 2017 RZ15 | 2020-Jan-15 | 12.1 LD | 7.4 | 14 |
| 2009 BH2 | 2020-Jan-18 | 14.6 LD | 17.9 | 118 |
| 2013 DU | 2020-Jan-20 | 15.3 LD | 6.4 | 59 |
| 2019 TF2 | 2020-Jan-23 | 16.2 LD | 1.6 | 18 |
| 2018 BM5 | 2020-Jan-23 | 13.1 LD | 8.6 | 12 |
| 2018 AL12 | 2020-Jan-30 | 18.2 LD | 17.7 | 39 |
| 2018 BU1 | 2020-Feb-02 | 19.4 LD | 10 | 41 |
Notes: LD means "Lunar Distance." 1 LD = 384,401 km, the distance between Earth and the Moon. 1 LD also equals 0.00256 AU. MAG is the visual magnitude of the asteroid on the date of closest approach. | | Cosmic Rays in the Atmosphere |
SOMETHING NEW! We have developed a new predictive model of aviation radiation. It's called E-RAD--short for Empirical RADiation model. We are constantly flying radiation sensors onboard airplanes over the US and and around the world, so far collecting more than 22,000 gps-tagged radiation measurements. Using this unique dataset, we can predict the dosage on any flight over the USA with an error no worse than 15%.
E-RAD lets us do something new: Every day we monitor approximately 1400 flights criss-crossing the 10 busiest routes in the continental USA. Typically, this includes more than 80,000 passengers per day. E-RAD calculates the radiation exposure for every single flight.
The Hot Flights Table is a daily summary of these calculations. It shows the 5 charter flights with the highest dose rates; the 5 commercial flights with the highest dose rates; 5 commercial flights with near-average dose rates; and the 5 commercial flights with the lowest dose rates. Passengers typically experience dose rates that are 20 to 70 times higher than natural radiation at sea level.
To measure radiation on airplanes, we use the same sensors we fly to the stratosphere onboard Earth to Sky Calculus cosmic ray balloons: neutron bubble chambers and X-ray/gamma-ray Geiger tubes sensitive to energies between 10 keV and 20 MeV. These energies span the range of medical X-ray machines and airport security scanners.
Column definitions: (1) The flight number; (2) The maximum dose rate during the flight, expressed in units of natural radiation at sea level; (3) The maximum altitude of the plane in feet above sea level; (4) Departure city; (5) Arrival city; (6) Duration of the flight.
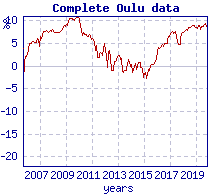
SPACE WEATHER BALLOON DATA: Approximately once a week, Spaceweather.com and the students of Earth to Sky Calculus fly space weather balloons to the stratosphere over California. These balloons are equipped with radiation sensors that detect cosmic rays, a surprisingly "down to Earth" form of space weather. Cosmic rays can seed clouds, trigger lightning, and penetrate commercial airplanes. Furthermore, there are studies ( #1, #2, #3, #4) linking cosmic rays with cardiac arrhythmias and sudden cardiac death in the general population. Our latest measurements show that cosmic rays are intensifying, with an increase of more than 18% since 2015:
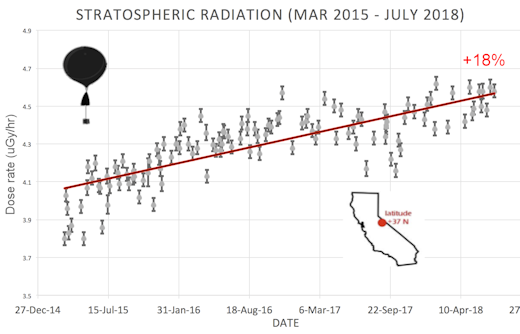
The data points in the graph above correspond to the peak of the Reneger-Pfotzer maximum, which lies about 67,000 feet above central California. When cosmic rays crash into Earth's atmosphere, they produce a spray of secondary particles that is most intense at the entrance to the stratosphere. Physicists Eric Reneger and Georg Pfotzer discovered the maximum using balloons in the 1930s and it is what we are measuring today.
En route to the stratosphere, our sensors also pass through aviation altitudes:
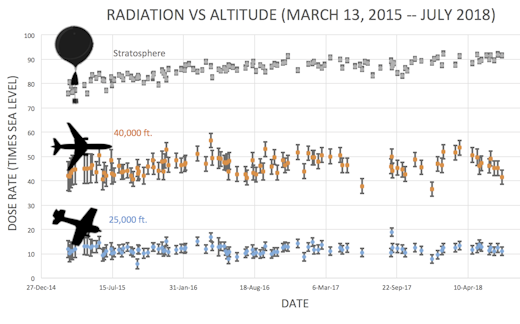
In this plot, dose rates are expessed as multiples of sea level. For instance, we see that boarding a plane that flies at 25,000 feet exposes passengers to dose rates ~10x higher than sea level. At 40,000 feet, the multiplier is closer to 50x.
The radiation sensors onboard our helium balloons detect X-rays and gamma-rays in the energy range 10 keV to 20 MeV. These energies span the range of medical X-ray machines and airport security scanners.
Why are cosmic rays intensifying? The main reason is the sun. Solar storm clouds such as coronal mass ejections (CMEs) sweep aside cosmic rays when they pass by Earth. During Solar Maximum, CMEs are abundant and cosmic rays are held at bay. Now, however, the solar cycle is swinging toward Solar Minimum, allowing cosmic rays to return. Another reason could be the weakening of Earth's magnetic field, which helps protect us from deep-space radiation.
| | The official U.S. government space weather bureau |
| | The first place to look for information about sundogs, pillars, rainbows and related phenomena. |
| | Researchers call it a "Hubble for the sun." SDO is the most advanced solar observatory ever. |
| | 3D views of the sun from NASA's Solar and Terrestrial Relations Observatory |
| | Realtime and archival images of the Sun from SOHO. |
| | from the NOAA Space Environment Center |
| | fun to read, but should be taken with a grain of salt! Forecasts looking ahead more than a few days are often wrong. |
| | from the NOAA Space Environment Center |
| | the underlying science of space weather |
 | To find reviews of new online casino sites in the UK try The Casino DB where there are hundreds of online casino reviews complete with bonuses and ratings. Get a bonus when playing at a new casino in the UK. The Genie got you covered! Looking for a new online casino? Try Casimpo the new site dedicated to making online casino simple and easy for all. |
| | These links help Spaceweather.com stay online. Thank you to our supporters! |
| | | | | | |


