This is an AI Free Zone: AI isn't all bad. Large language models are good writers with access to vast stores of data. There's still no substitute for a human being with decades of space weather forecasting experience. This website is 100% human.
|
|
|
WHAT WAS THAT DARK SHADOW ON SATURN? A rare event just wrapped up on Saturn. Earlier today, the black shadow of Titan drifted across the ringed planet's cloudtops. Many backyard astronomers in the Americas oberved the beautiful transit. Titan shadow transits occur only every 15 years during Saturn's equinoxes. The next transit in the current series is Aug. 3rd. Mark your calendar!
MOTHS FOLLOW THE MILKY WAY: Astronomers come in all shapes and sizes--even invertebrates. A new study published in Nature reveals that Australian moths can see and decipher the night sky. They pay particular attention to the Milky Way and seem capable of navigating using the Carina nebula as a visual landmark.
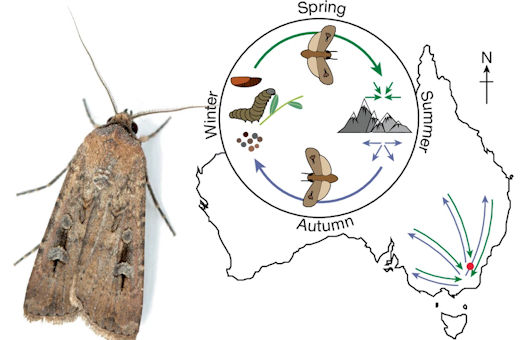
Above: A male Bogong moth and a diagram of their annual migration.
Every spring in southeast Australia, billions of Bogong moths take flight under cover of darkness. It's the beginning of an epic migration as much as 1,000 kilometers long. Their destination: a small cluster of caves in the Australian Alps--places the moths have never visited before, yet somehow navigate to with remarkable precision. Their compass, it turns out, is the night sky itself.
Reaching this conclusion required the researchers to do something you probably don't want to think about too closely: They attached the moths to tiny little tethers. Moths could lift off and pick a direction, but not escape.
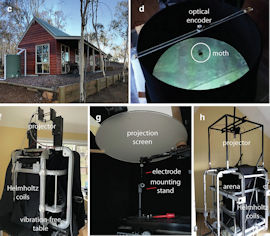 The experiment unfolded inside a special moth planetarium (pictured right). Star patterns were projected onto an overhead screen, while the ambient magnetic field was nulled by Helmholtz coils, guaranteeing that the participants could not "cheat" using magnetic navigation. When shown a normal star field, the moths oriented in the correct direction. But when the stars were scrambled into random patterns, they lost their bearings.
To dig deeper, the researchers recorded activity from visual neurons in the moths' brains as a projected night sky rotated overhead. Neurons fired most strongly when the stars aligned with the moth's inherited migratory heading. Some neurons were tuned to the brightest region of the Milky Way (especially near the Carina nebula) suggesting that this band of starlight is a visual landmark.
Clouds produced the next revelation: Bogong moths remained oriented even when stars were hidden. In those cases, they relied on Earth’s magnetic field instead, revealing a dual-compass system similar to that of migratory birds. When both stellar and magnetic cues were removed, the moths became disoriented again.
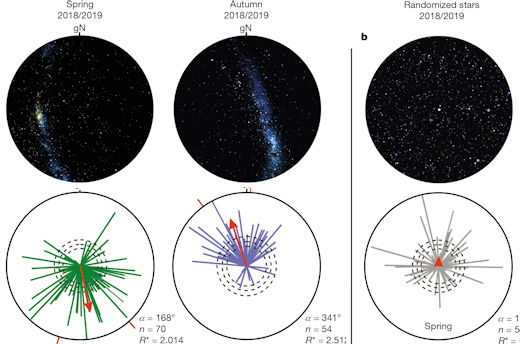
Upper row: Laboratory-projected night skies during spring and autumn, and an autumn sky with its stars randomly arranged. Lower row: The moths' reaction to each sky.
In recent years, scientists have discovered that many creatures are guided by the stars. In addition to humans, the list includes migratory songbirds, possibly seals, dung beetles, cricket frogs, and now Bogong moths. The list of lifeforms guided by magnetism is even longer, ranging in size from microbes to whales.
You can read the original research here.
Realtime Space Weather Photo Gallery
Free: Spaceweather.com Newsletter
IT'S CHRISTMAS IN JULY: Are you looking for a far-out gift? Check out the Earth to Sky Store. It's filled with unique items that have flown to the edge of space onboard cosmic ray research balloons.
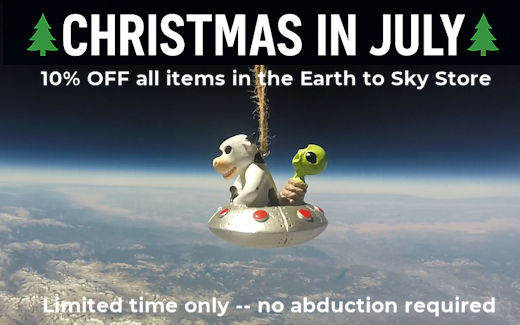
Carried aloft by giant helium balloons, these unique gifts have flown above 99.7% of Earth's atmosphere, experiencing space-like blasts of cosmic rays, extreme cold, and a wild ride parachuting back to Earth after the balloon explodes. Even Amazon doesn't carry items this far out.
Enter coupon code "JULY" at checkout for a 10% Christmas-in-July discount.
Far Out Gifts: Earth to Sky Store
All sales support hands-on STEM education
Realtime Aurora Photo Gallery
Free: Spaceweather.com Newsletter
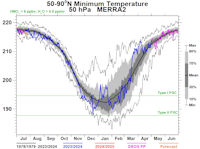
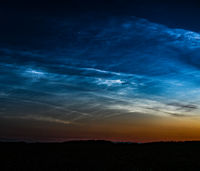
Realtime Noctilucent Cloud Photo Gallery
Free: Spaceweather.com Newsletter
Every night, a network
of
NASA
all-sky cameras scans the skies above the United
States for meteoritic fireballs. Automated software
maintained by NASA's Meteoroid Environment Office
calculates their orbits, velocity, penetration depth
in Earth's atmosphere and many other characteristics.
Daily results are presented here on Spaceweather.com.
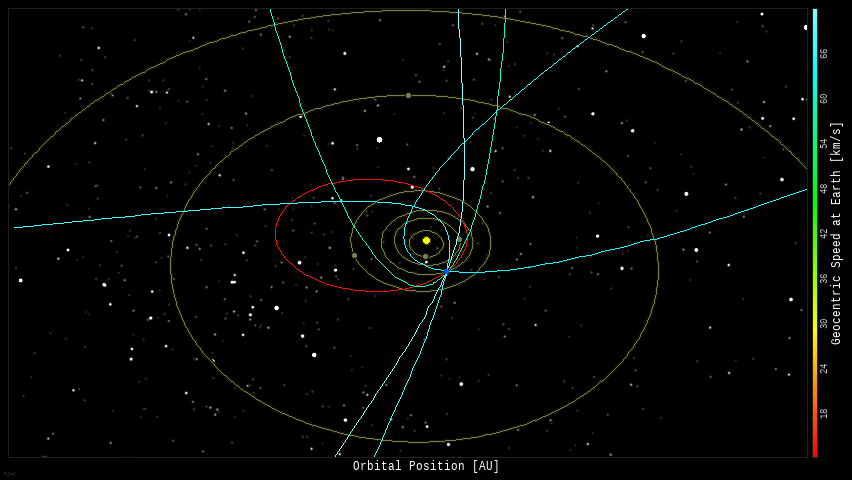
On Jul 17, 2025, the network reported 4 fireballs.
(4 sporadics)
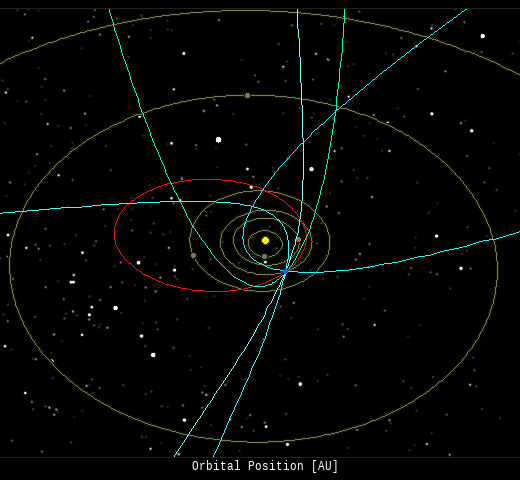
In this diagram of the inner solar system, all of the fireball orbits intersect at a single point--Earth. The orbits are color-coded by velocity, from slow (red) to fast (blue).
[Larger image] [movies]
Potentially Hazardous Asteroids (
PHAs)
are space rocks larger than approximately 100m that
can come closer to Earth than 0.05 AU. None of the
known PHAs is on a collision course with our planet,
although astronomers are finding
new
ones all the time.
On July 19, 2025 there were 2349 potentially hazardous asteroids.
 |
Recent
& Upcoming Earth-asteroid encounters:
| Asteroid |
Date(UT) |
Miss Distance |
Velocity (km/s) |
Diameter (m) |
| 2025 OK |
2025-Jul-13 |
2.9 LD |
7 |
11 |
| 2025 MA90 |
2025-Jul-15 |
16.9 LD |
9 |
89 |
| 2025 OF |
2025-Jul-15 |
1 LD |
16.1 |
15 |
| 2025 OC |
2025-Jul-17 |
0.8 LD |
6.9 |
9 |
| 2022 YS5 |
2025-Jul-17 |
17.4 LD |
6.1 |
38 |
| 2025 OA |
2025-Jul-17 |
2.5 LD |
14.2 |
16 |
| 2025 OB |
2025-Jul-18 |
3.3 LD |
14.1 |
22 |
| 2018 BY6 |
2025-Jul-19 |
13.7 LD |
7.4 |
68 |
| 2025 ME92 |
2025-Jul-20 |
13.4 LD |
5.3 |
30 |
| 2019 CO1 |
2025-Aug-08 |
17.8 LD |
10.5 |
65 |
| 2022 QB1 |
2025-Aug-10 |
8.9 LD |
3.9 |
6 |
| 2021 PJ1 |
2025-Aug-15 |
4.4 LD |
9.3 |
24 |
| 2025 CO3 |
2025-Aug-16 |
19.8 LD |
8.4 |
90 |
| 1997 QK1 |
2025-Aug-20 |
7.9 LD |
9.8 |
315 |
| 2022 QD3 |
2025-Aug-21 |
15 LD |
6.9 |
35 |
| 2023 PX |
2025-Aug-22 |
2.4 LD |
8.3 |
23 |
| 2019 QQ6 |
2025-Aug-24 |
9.4 LD |
17.2 |
31 |
| 2017 RK15 |
2025-Aug-29 |
15.8 LD |
13.2 |
26 |
| 2020 TS1 |
2025-Aug-29 |
17.8 LD |
3.3 |
5 |
| 1998 SH2 |
2025-Aug-30 |
8.1 LD |
17.3 |
246 |
| 2019 JG1 |
2025-Sep-09 |
18.8 LD |
7.9 |
17 |
| 2009 FF |
2025-Sep-11 |
6.8 LD |
12.9 |
155 |
| 2015 SA |
2025-Sep-13 |
10.3 LD |
9.1 |
31 |
| 2022 SS2 |
2025-Sep-13 |
2.4 LD |
7.2 |
13 |
Notes: LD means
"Lunar Distance." 1 LD = 384,401 km, the distance
between Earth and the Moon. 1 LD also equals 0.00256
AU.
| |
Cosmic Rays in the Atmosphere |
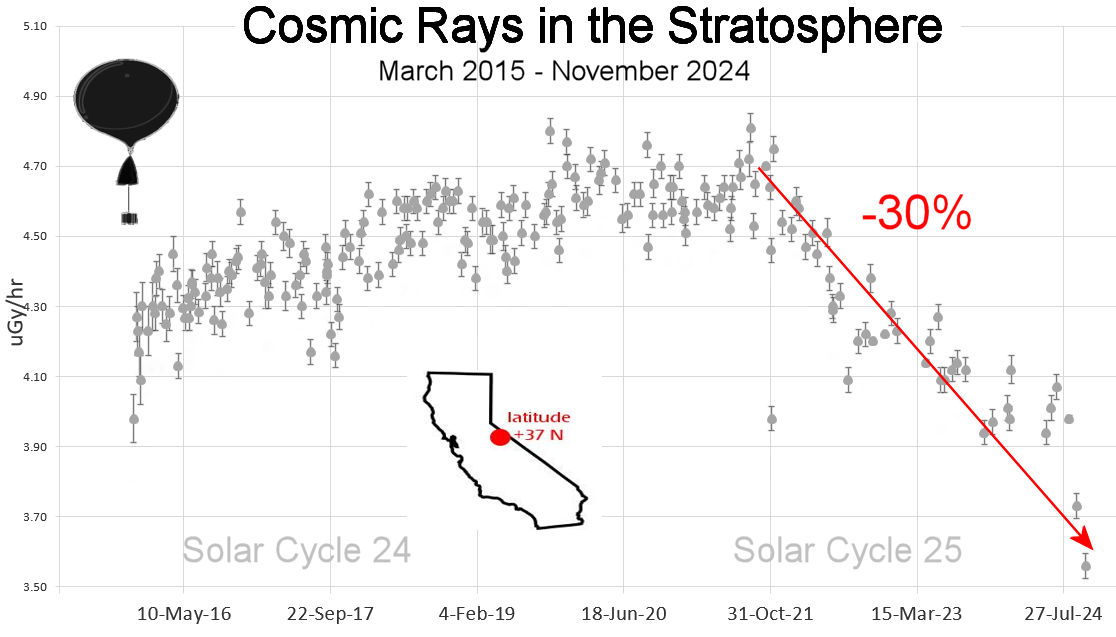
SPACE WEATHER BALLOON DATA: Almost once a week, Spaceweather.com and the students of Earth to Sky Calculus fly space weather balloons to the stratosphere over California. These balloons are equipped with sensors that detect secondary cosmic rays, a form of radiation from space that can penetrate all the way down to Earth's surface. Our monitoring program has been underway without interruption for 10 years, resulting in a unique dataset of in situ atmospheric measurements.
Latest results (Nov. 2024): Atmospheric radiation is sharply decreasing in 2024. Our latest measurements in November registered a 10-year low:
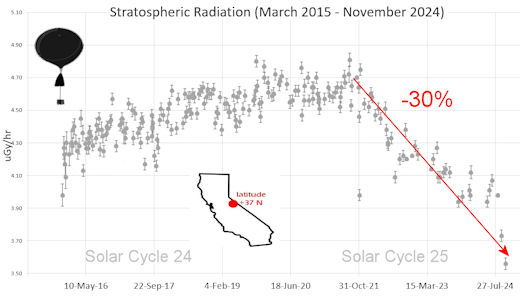
What's going on? Ironically, the radiation drop is caused by increasing solar activity. Solar Cycle 25 has roared to life faster than forecasters expected. The sun's strengthening and increasingly tangled magnetic field repels cosmic rays from deep space. In addition, solar coronal mass ejections (CMEs) sweep aside cosmic rays, causing sharp reductions called "Forbush Decreases." The two effects blend together to bring daily radiation levels down.
.Who cares? Cosmic rays are a surprisingly "down to Earth" form of space weather. They can alter the chemistry of the atmosphere, trigger lightning, and penetrate commercial airplanes. According to a study from the Harvard T.H. Chan school of public health, crews of aircraft have higher rates of cancer than the general population. The researchers listed cosmic rays, irregular sleep habits, and chemical contaminants as leading risk factors. A number of controversial studies (#1, #2, #3, #4) go even further, linking cosmic rays with cardiac arrhythmias and sudden cardiac death.
Technical notes: The radiation sensors onboard our helium balloons detect X-rays and gamma-rays in the energy range 10 keV to 20 MeV. These energies span the range of medical X-ray machines and airport security scanners.
Data points in the graph labeled "Stratospheric Radiation" correspond to the peak of the Regener-Pfotzer maximum, which lies about 67,000 feet above central California. When cosmic rays crash into Earth's atmosphere, they produce a spray of secondary particles that is most intense at the entrance to the stratosphere. Physicists Eric Regener and Georg Pfotzer discovered the maximum using balloons in the 1930s and it is what we are measuring today.
| |
The
official U.S. government space weather bureau |
| |
The
first place to look for information about sundogs,
pillars, rainbows and related phenomena. |
| |
Researchers
call it a "Hubble for the sun." SDO
is the most advanced solar observatory ever. |
| |
3D
views of the sun from NASA's Solar and Terrestrial
Relations Observatory |
| |
Realtime
and archival images of the Sun from SOHO. |
| |
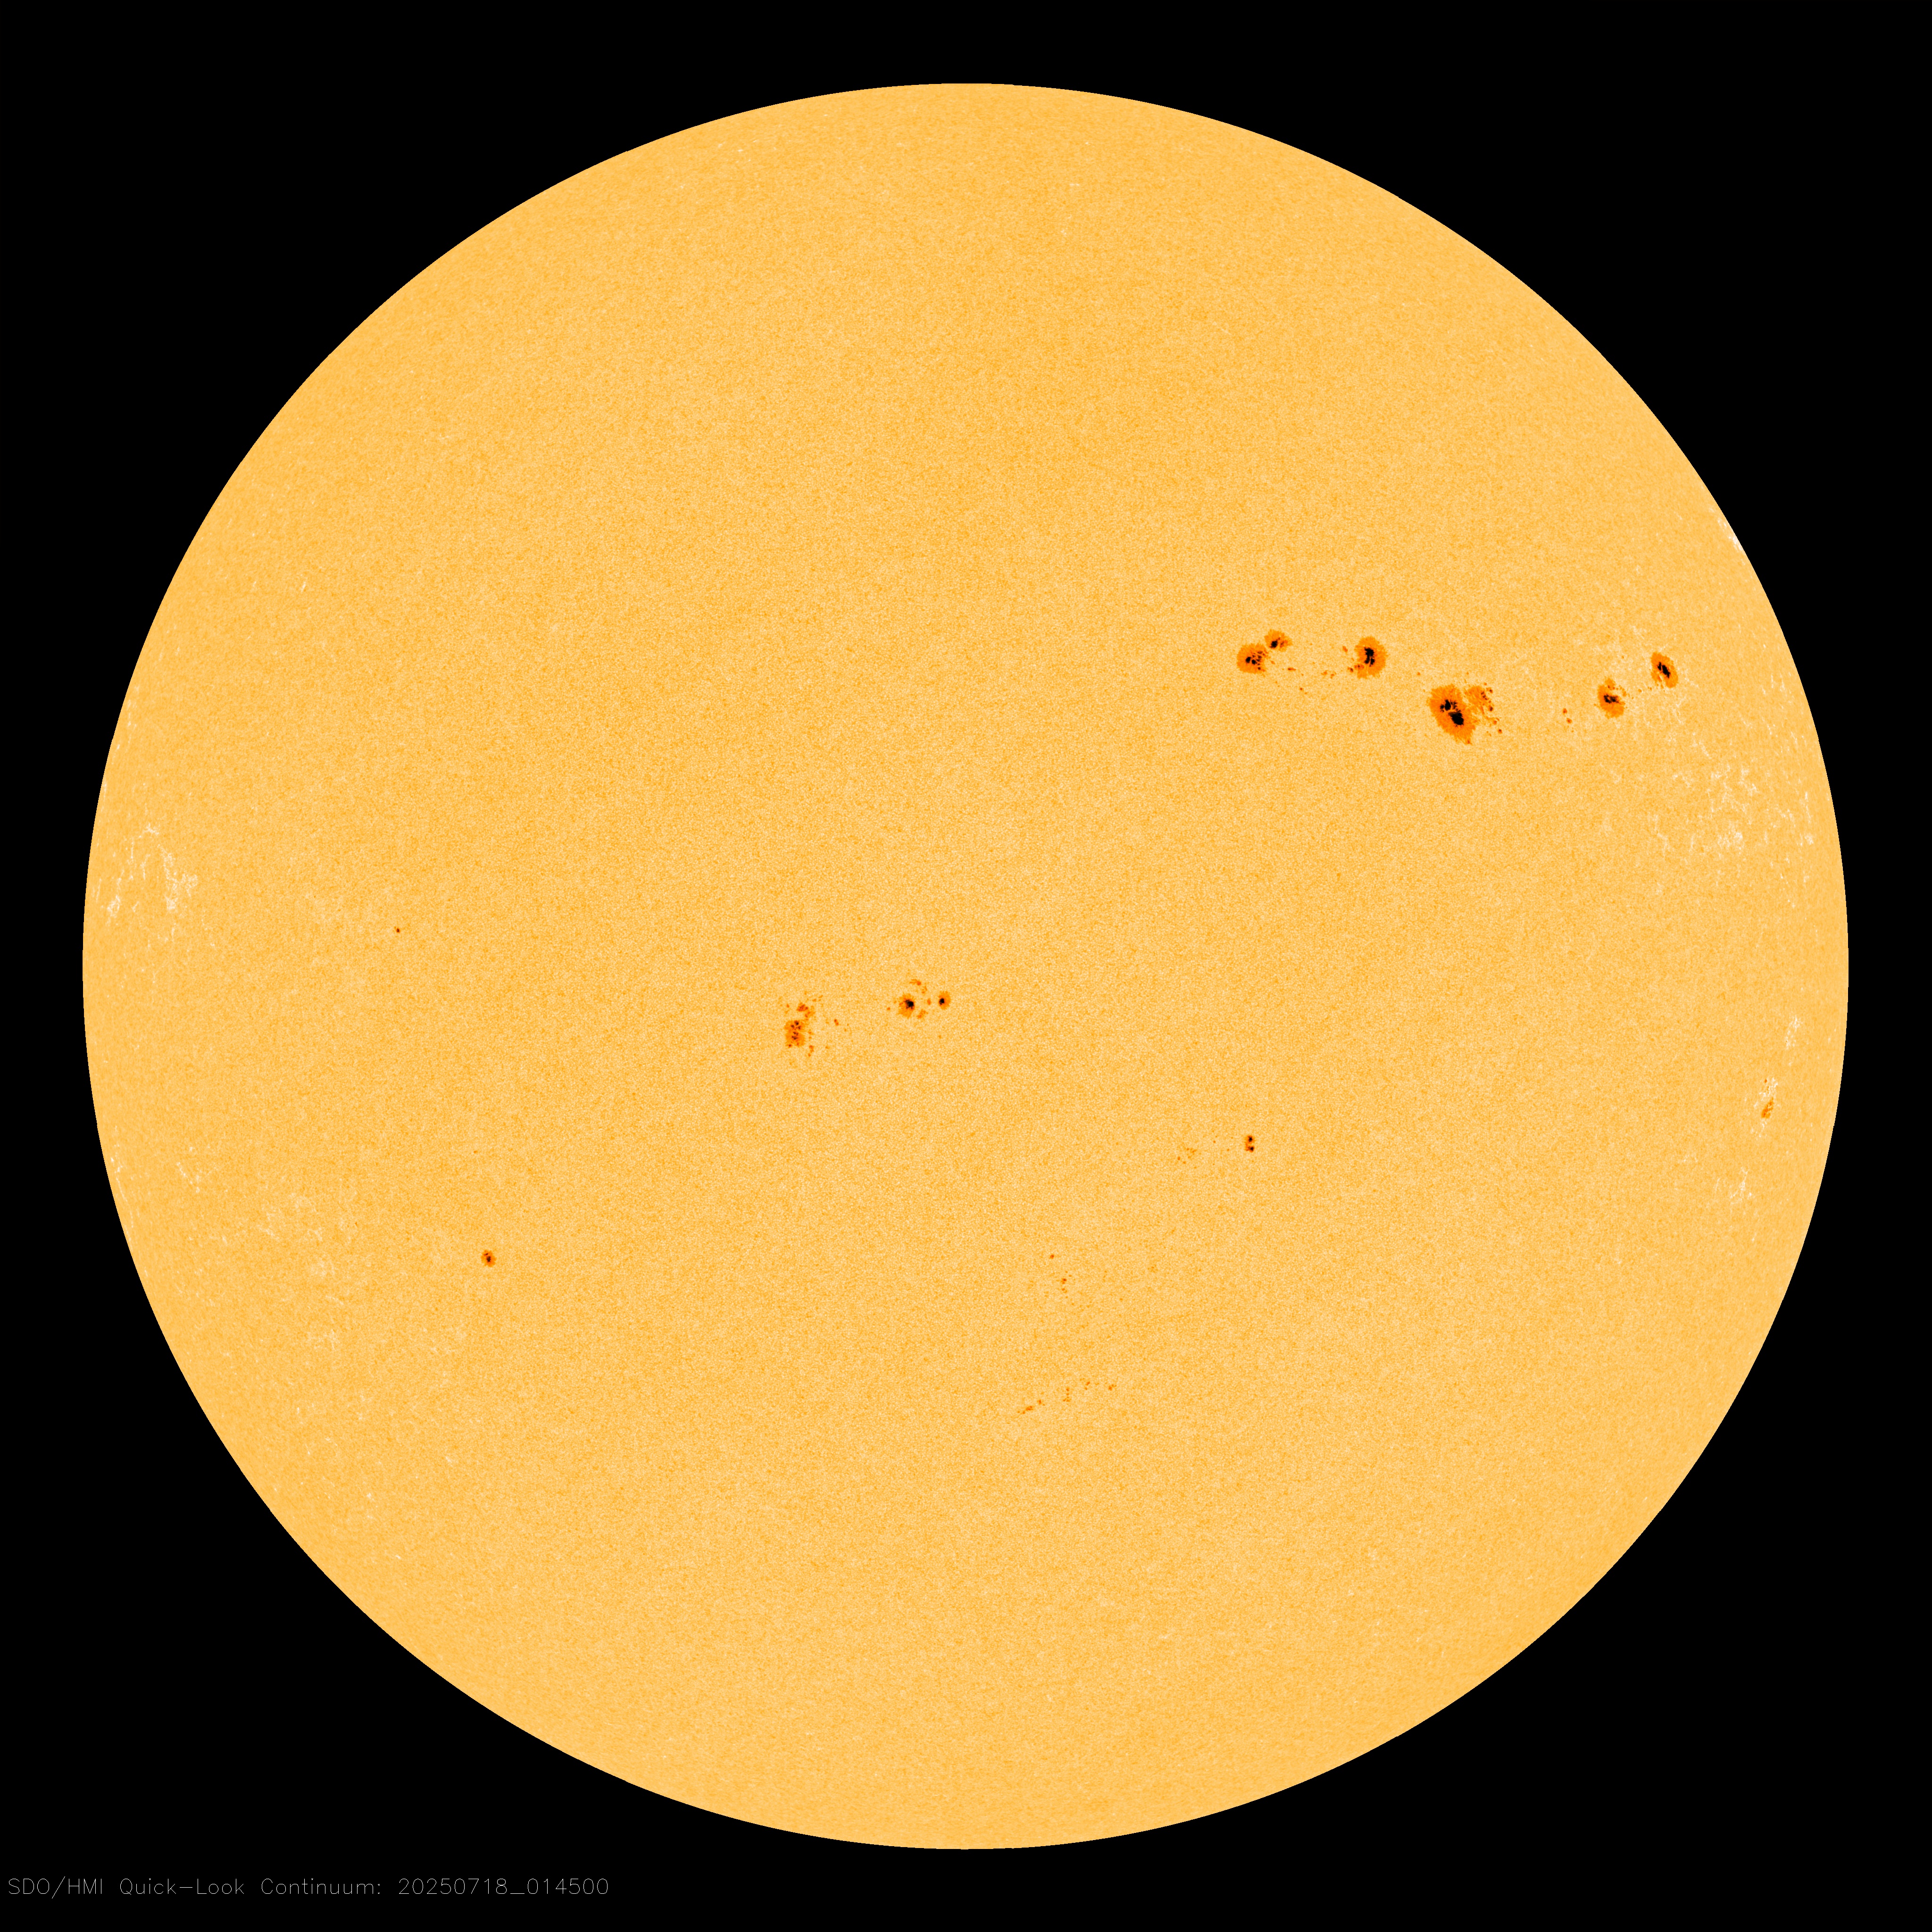
information about sunspots based on the latest NOAA/USAF Active Region Summary |
| |
current counts of failed and deployed Starlink satellites from Jonathan's Space Page. See also, all satellite statistics. |
| |
Authoritative predictions of space junk and satellite re-entries |
| |
from
the NOAA Space Environment Center |
| |
fun to read, but should be taken with a grain of salt! Forecasts looking ahead more than a few days are often wrong. |
| |
from the NOAA Space Environment Center |
| |
the
underlying science of space weather |
 |
Got a chipped or cracked windshield that prevents you from seeing space weather events while driving? Get windshield replacement from SR Windows & Glass with free mobile auto glass service anywhere in the Phoenix area. |
|
BestCSGOGambling is the best site for everything related to CSGO gambling on the web |
| |
These links help Spaceweather.com stay online. Thank you to our supporters! |
|
|
| |
|
|
|


