| Asteroid |
Date(UT) |
Miss Distance |
Velocity (km/s) |
Diameter (m) |
| 2015 BF |
2026-Jul-26 |
17.3 LD |
12.5 |
17 |
| 2026 OA3 |
2026-Jul-27 |
4.9 LD |
5.2 |
23 |
| 2026 OL |
2026-Jul-27 |
15.9 LD |
15.9 |
87 |
| 2026 OX3 |
2026-Jul-27 |
0.7 LD |
9.5 |
14 |
| 2026 OR |
2026-Jul-28 |
10.4 LD |
10.4 |
16 |
| 2025 OW |
2026-Jul-30 |
16.1 LD |
20.1 |
70 |
| 2026 OS |
2026-Aug-01 |
3.1 LD |
5.8 |
9 |
| 2024 RM10 |
2026-Aug-05 |
13.6 LD |
7.5 |
24 |
| 2026 OE1 |
2026-Aug-07 |
7.6 LD |
10.2 |
51 |
| 173561 |
2026-Aug-09 |
13.1 LD |
16.2 |
756 |
| 2019 NY2 |
2026-Aug-10 |
6.6 LD |
9.6 |
195 |
| 2013 QC11 |
2026-Aug-13 |
14.5 LD |
19 |
172 |
| 2026 NY |
2026-Aug-13 |
12.3 LD |
8.1 |
101 |
| 2025 AL2 |
2026-Aug-16 |
2.2 LD |
12.4 |
100 |
| 2025 DU7 |
2026-Aug-19 |
8.7 LD |
2.9 |
5 |
| 2025 FY11 |
2026-Aug-20 |
19.2 LD |
3.5 |
6 |
| 2023 RL |
2026-Aug-25 |
12.9 LD |
4.8 |
7 |
| 523609 |
2026-Aug-27 |
18.5 LD |
22.7 |
441 |
| 2025 QM9 |
2026-Aug-28 |
15.2 LD |
11.1 |
20 |
| 221455 |
2026-Aug-28 |
9.4 LD |
19 |
443 |
| 2017 BP31 |
2026-Aug-28 |
11.2 LD |
20.5 |
382 |
| 2007 EK |
2026-Aug-30 |
10.9 LD |
9.1 |
5 |
| 2017 RH16 |
2026-Aug-31 |
8.7 LD |
12.1 |
21 |
| 2025 CL3 |
2026-Sep-01 |
9.6 LD |
13.5 |
30 |
| 2018 RD2 |
2026-Sep-01 |
19.5 LD |
9.6 |
14 |
| 2025 QV5 |
2026-Sep-02 |
14.2 LD |
7.3 |
12 |
| 2020 YA5 |
2026-Sep-06 |
19.5 LD |
10.4 |
47 |
| 2022 RK |
2026-Sep-06 |
13.7 LD |
8.6 |
24 |
| 2024 RV12 |
2026-Sep-09 |
5.6 LD |
12.1 |
22 |
| 2026 OH3 |
2026-Sep-11 |
12.4 LD |
20.2 |
198 |
| 2025 RQ2 |
2026-Sep-11 |
17.5 LD |
12.1 |
17 |
| 2010 FX9 |
2026-Sep-14 |
9.4 LD |
11.1 |
55 |
| 2025 SC |
2026-Sep-14 |
19.2 LD |
1.9 |
3 |
| 2024 RP12 |
2026-Sep-16 |
17.9 LD |
6.6 |
51 |
| 2026 NT2 |
2026-Sep-17 |
16.1 LD |
12.5 |
279 |
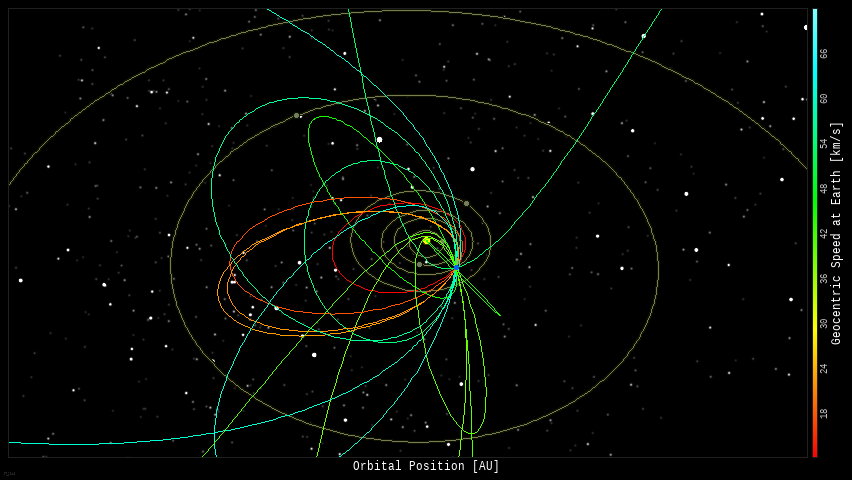
Notes: LD means
"Lunar Distance." 1 LD = 384,401 km, the distance
between Earth and the Moon. 1 LD also equals 0.00256
AU.
| |
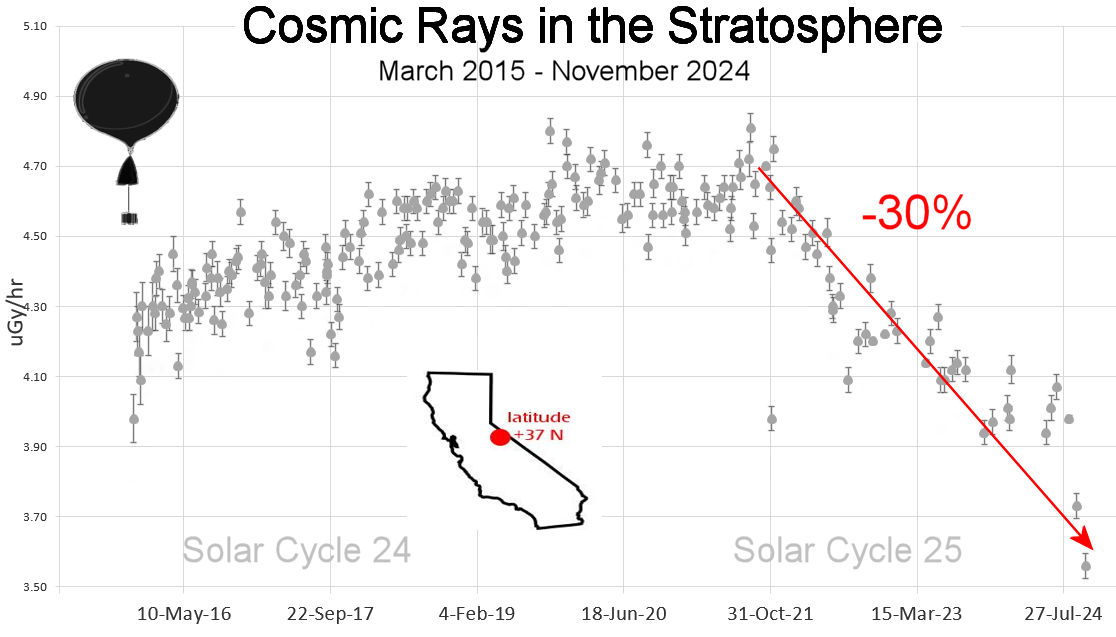
Cosmic Rays in the Atmosphere |
SPACE WEATHER BALLOON DATA: Almost once a week, Spaceweather.com and the students of Earth to Sky Calculus fly space weather balloons to the stratosphere over California. These balloons are equipped with sensors that detect secondary cosmic rays, a form of radiation from space that can penetrate all the way down to Earth's surface. Our monitoring program has been underway without interruption for 10 years, resulting in a unique dataset of in situ atmospheric measurements.
Latest results (Nov. 2024): Atmospheric radiation is sharply decreasing in 2024. Our latest measurements in November registered a 10-year low:
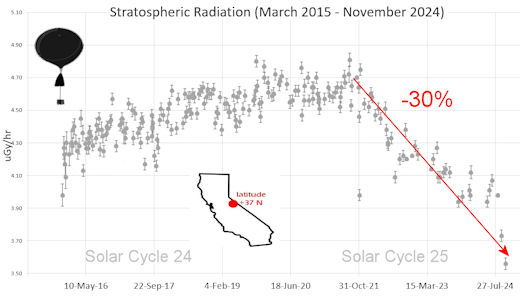
What's going on? Ironically, the radiation drop is caused by increasing solar activity. Solar Cycle 25 has roared to life faster than forecasters expected. The sun's strengthening and increasingly tangled magnetic field repels cosmic rays from deep space. In addition, solar coronal mass ejections (CMEs) sweep aside cosmic rays, causing sharp reductions called "Forbush Decreases." The two effects blend together to bring daily radiation levels down.
.Who cares? Cosmic rays are a surprisingly "down to Earth" form of space weather. They can alter the chemistry of the atmosphere, trigger lightning, and penetrate commercial airplanes. According to a study from the Harvard T.H. Chan school of public health, crews of aircraft have higher rates of cancer than the general population. The researchers listed cosmic rays, irregular sleep habits, and chemical contaminants as leading risk factors. A number of controversial studies (#1, #2, #3, #4) go even further, linking cosmic rays with cardiac arrhythmias and sudden cardiac death.
Technical notes: The radiation sensors onboard our helium balloons detect X-rays and gamma-rays in the energy range 10 keV to 20 MeV. These energies span the range of medical X-ray machines and airport security scanners.
Data points in the graph labeled "Stratospheric Radiation" correspond to the peak of the Regener-Pfotzer maximum, which lies about 67,000 feet above central California. When cosmic rays crash into Earth's atmosphere, they produce a spray of secondary particles that is most intense at the entrance to the stratosphere. Physicists Eric Regener and Georg Pfotzer discovered the maximum using balloons in the 1930s and it is what we are measuring today.
| |
The
official U.S. government space weather bureau |
| |
The
first place to look for information about sundogs,
pillars, rainbows and related phenomena. |
| |
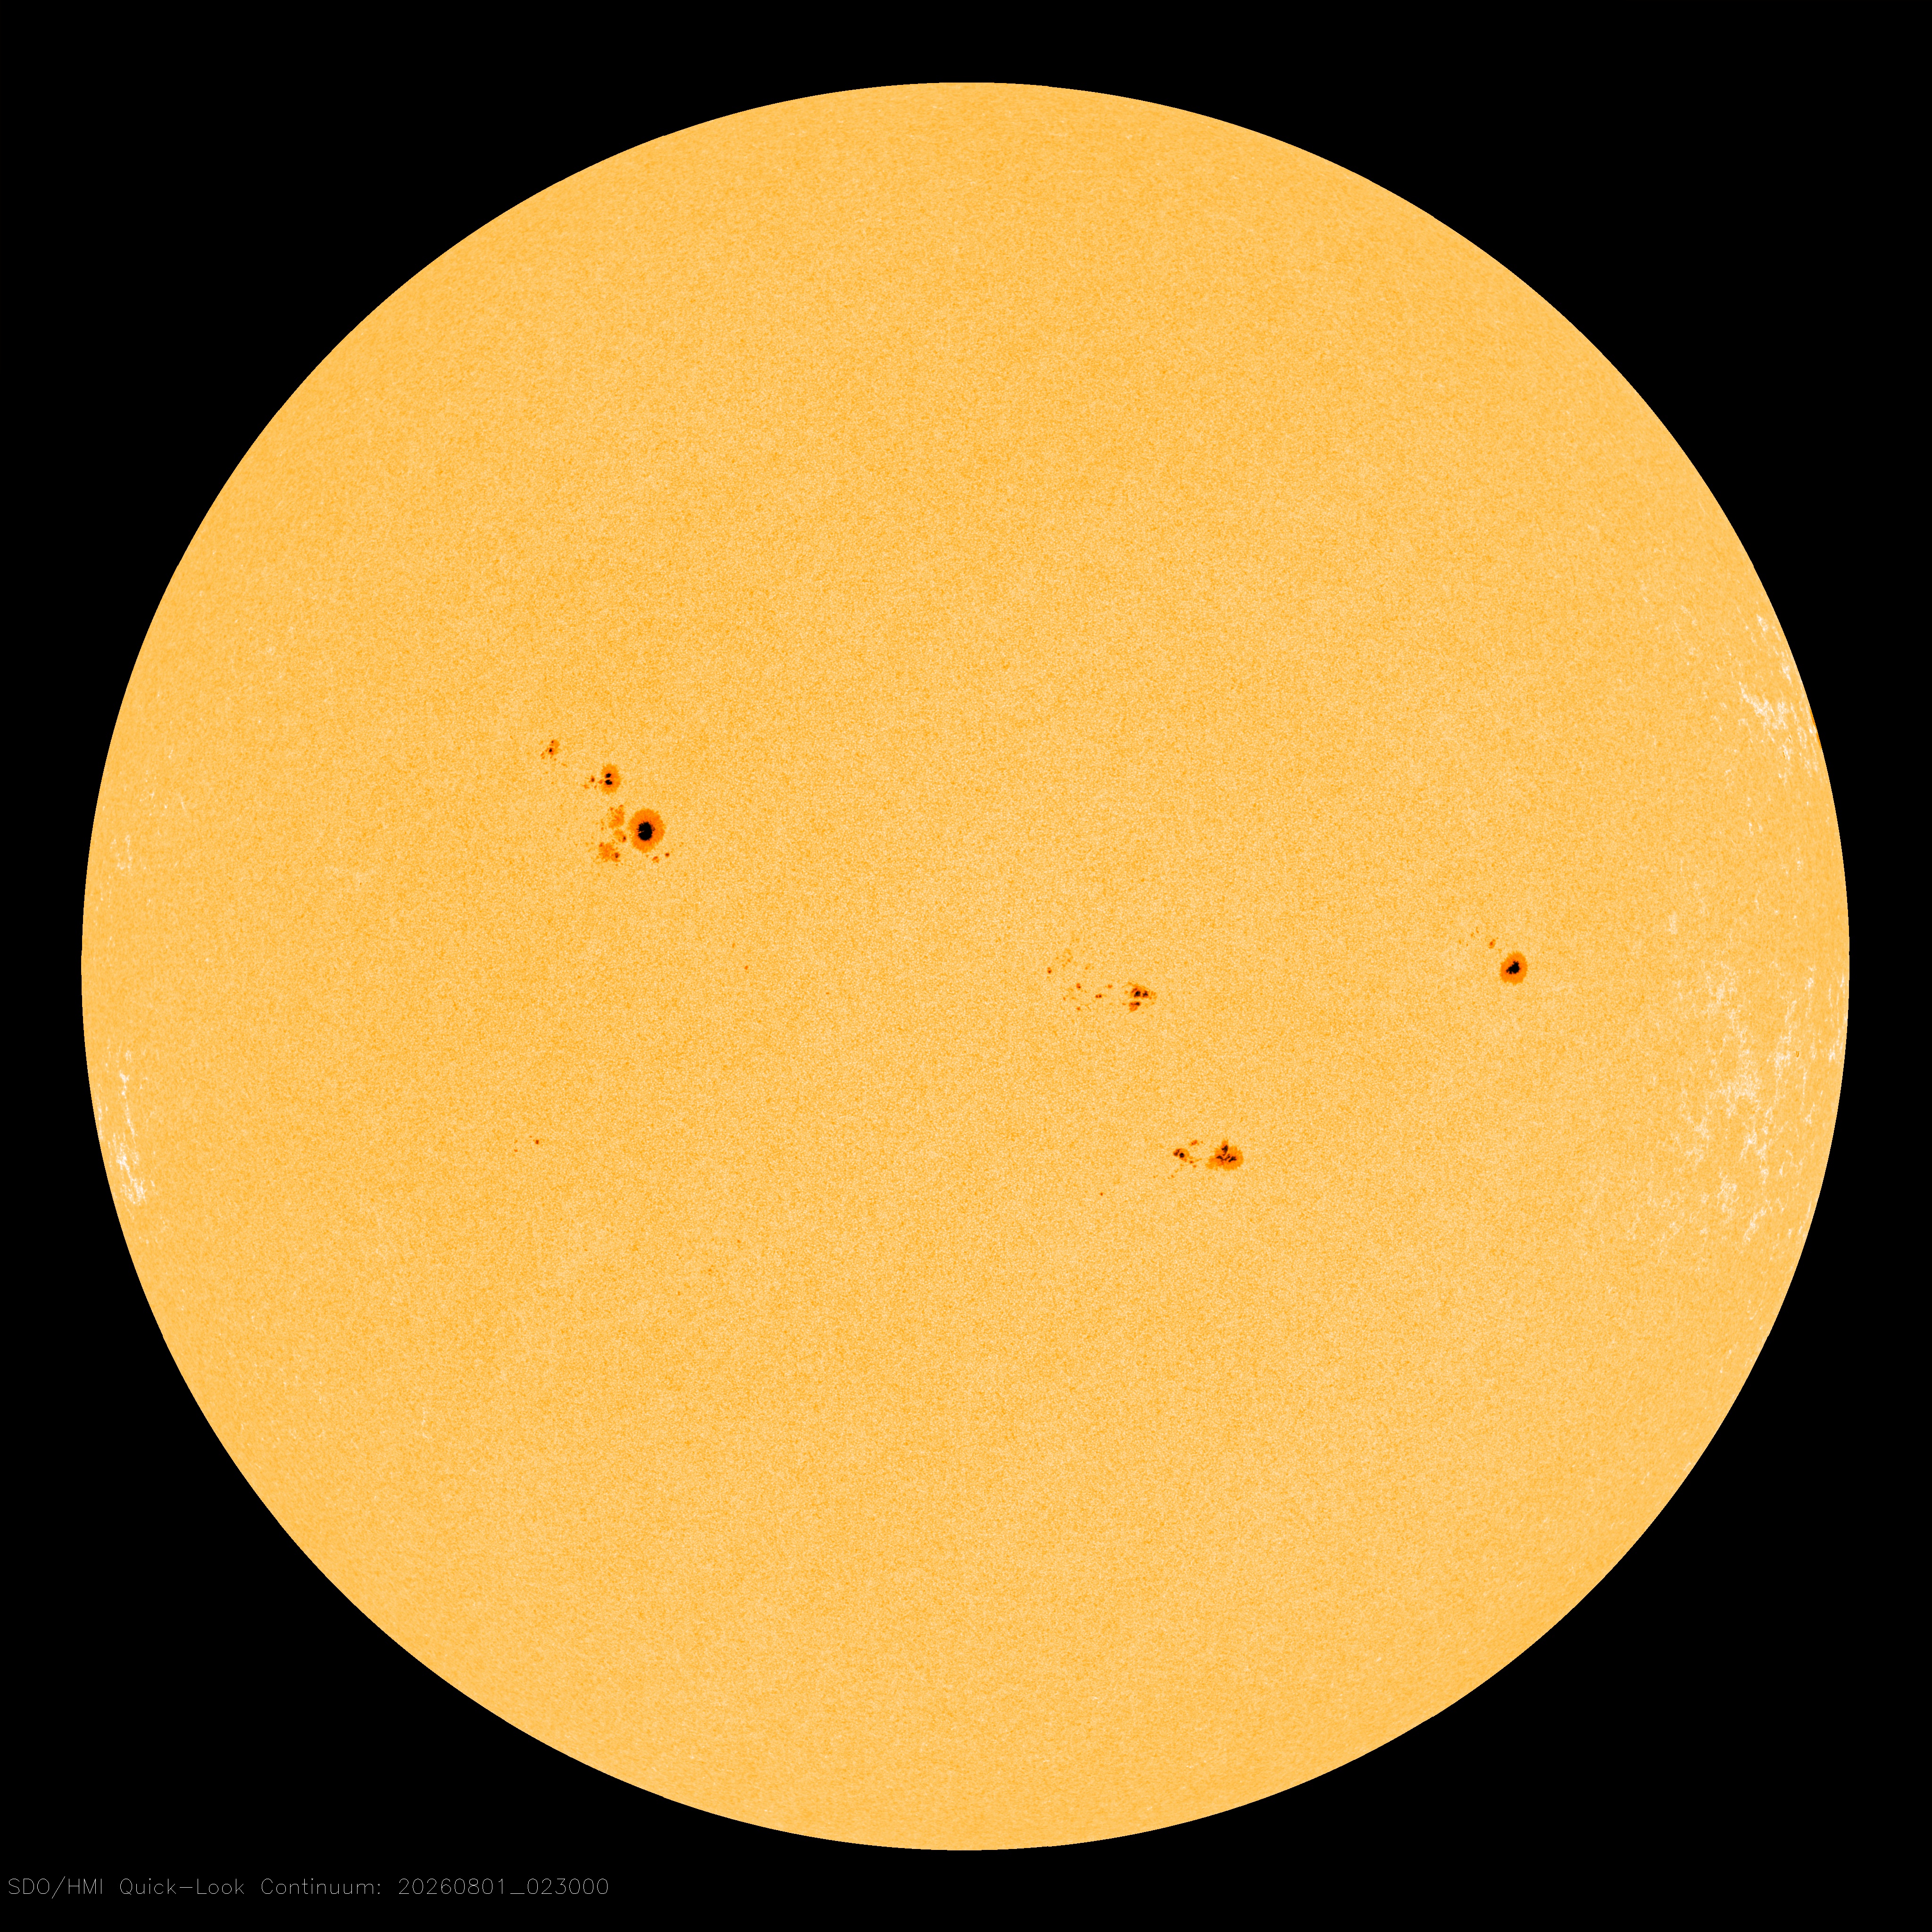
Researchers
call it a "Hubble for the sun." SDO
is the most advanced solar observatory ever. |
| |
3D
views of the sun from NASA's Solar and Terrestrial
Relations Observatory |
| |
Realtime
and archival images of the Sun from SOHO. |
| |
information about sunspots based on the latest NOAA/USAF Active Region Summary |
| |
current counts of failed and deployed Starlink satellites from Jonathan's Space Page. See also, all satellite statistics. |
| |
Authoritative predictions of space junk and satellite re-entries |
| |
from
the NOAA Space Environment Center |
| |
fun to read, but should be taken with a grain of salt! Forecasts looking ahead more than a few days are often wrong. |
| |
from the NOAA Space Environment Center |
| |
the
underlying science of space weather |
 |
Got a chipped or cracked windshield that prevents you from seeing space weather events while driving? Get windshield replacement from SR Windows & Glass with free mobile auto glass service anywhere in the Phoenix area. |
| |
These links help Spaceweather.com stay online. Thank you to our supporters! |
|
|
| |
|
|
|


