AI writing is everywhere -- except here. This website is written by Dr. Tony Phillips, a carbon-based lifeform with 30 yrs of forecasting experience. Our guarantee: If you find a mistake, it was made by a real human being. | | |
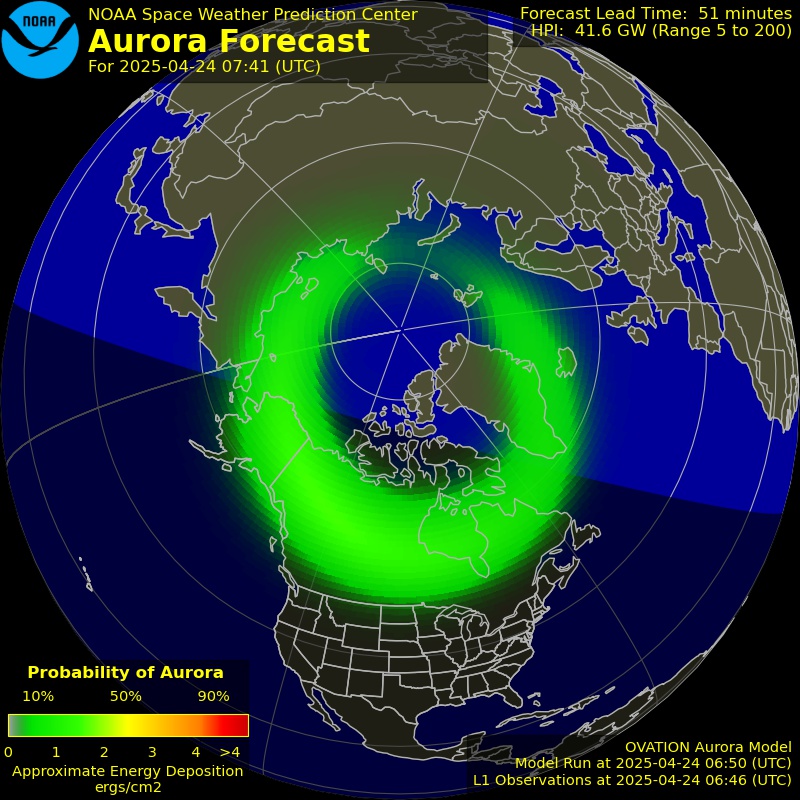
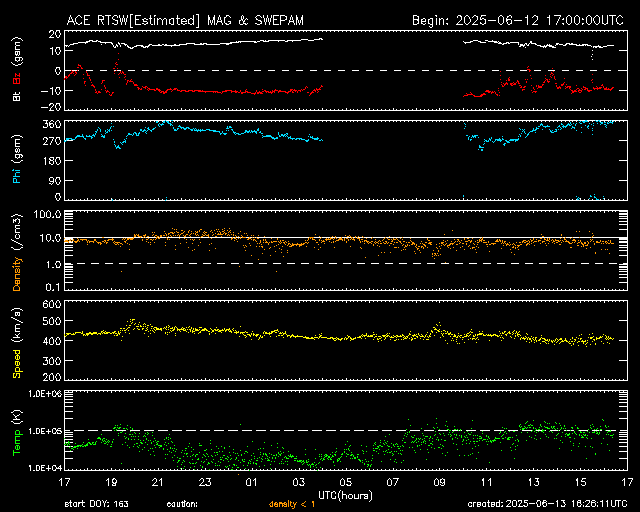
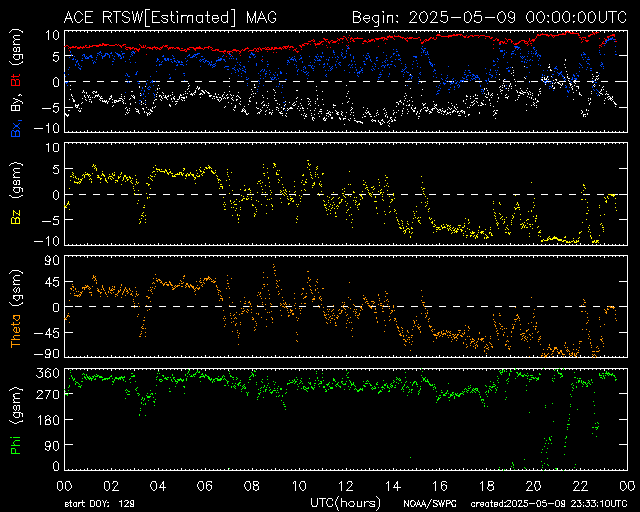
GEOMAGNETIC STORM WATCH (G1): A solar wind stream is approaching Earth. ETA: Oct. 20th. NOAA forecasters say that G1-class geomagnetic storms and high-latitude auroras are possible when it arrives. Aurora alerts: SMS Text.
SPACE WARFARE IN YOUR OWN EYEPIECE? The Pentagon isn’t commenting, and Russia has said nothing. But something is definitely happening in low Earth orbit.
Over the weekend, a Russian military satellite, Cosmos 2612, paid a visit to ICEYE-X36, a radar satellite that supplies imagery to Ukraine. The two came within a few hundred meters of each other, according to orbital data published by the US Space Force.

“To my knowledge this is the first LEO (low Earth orbit) rendezvous of two active satellites,” says satellite tracker Jonathan McDowell, recently retired from Harvard University.
The two are separating now. On Sunday, Cosmos 2612 fired its thrusters and raised its orbit by about 2 km. Dutch satellite analyst Marco Langbroek says it’s not yet clear whether Cosmos 2612 is leaving or setting up for another approach.
Does Cosmos 2612 pose a threat? Only Russia knows for sure. The satellite’s specs have never been published. It might be taking a closer look, jamming signals, or ... in 2020, another Russian satellite, Cosmos 2543, released a high-speed object in orbit. U.S. Space Command said it had the hallmarks of an anti-satellite weapon.
Located ~100 km above the orbit of the ISS, the satellites are extremely close together. During their weekend close approach, they were as little as 1 or 2 arcminutes apart--a single point to the human eye, but an easy split in binoculars or a small backyard telescope.
This means amateur astronomers can monitor developments. Southern observers are favored. Right now, the two satellites are making a series of pre-dawn passes over Australia and New Zealand with estimated magnitudes near +6 or +7.
Where should you point your telescope? Subscribers to our Backyard Astronomy Alert Service can send us a note to ask for bespoke flyby alerts and coordinates. We will help you find them.
Realtime Space Weather Photo Gallery
Free: Space Weather Newsletter
THE HALLOWEEN FIREBALLS ARE COMING: We love our new Backyard Astronomy Alert Service, and now is a good time to try it out. Earth is entering the Taurid debris stream--source of the annual Halloween fireballs. For the next 3 to 4 weeks, Earth will surf through a complex meteoroid field producing bright meteors often seen while trick-or-treating.
Subscribers to our service receive instant text messages when anything is happening in the sky--meteor outbursts, space station flybys, bright auroras and much more. Companion emails contain sky maps and observing tips--everything you need to fully experience the event. It also makes a great gift!
Far Out Gifts: Earth to Sky Store
All sales support hands-on STEM education
Realtime Aurora Photo Gallery
Free: Spaceweather.com Newsletter
Every night, a network of
NASA all-sky cameras scans the skies above the United States for meteoritic fireballs. Automated software maintained by NASA's Meteoroid Environment Office calculates their orbits, velocity, penetration depth in Earth's atmosphere and many other characteristics. Daily results are presented here on Spaceweather.com.
On October 19, 2026, the network reported 17 fireballs.
(9 sporadics, 4 Orionids, 2 epsilon Geminids, 2 Southern Taurids)

In this diagram of the inner solar system, all of the fireball orbits intersect at a single point--Earth. The orbits are color-coded by velocity, from slow (red) to fast (blue). [Larger image] [movies]
Potentially Hazardous Asteroids (
PHAs) are space rocks larger than approximately 100m that can come closer to Earth than 0.05 AU. None of the known PHAs is on a collision course with our planet, although astronomers are finding
new ones all the time.
On October 19, 2026 there were 2349 potentially hazardous asteroids.
 |
Recent & Upcoming Earth-asteroid encounters: | Asteroid | Date(UT) | Miss Distance | Velocity (km/s) | Diameter (m) |
| 2026 TG9 | 2026-Oct-14 | 0.6 LD | 11.7 | 12 |
| 2026 TO69 | 2026-Oct-14 | 4.5 LD | 12.1 | 21 |
| 2026 TZ102 | 2026-Oct-15 | 12.3 LD | 14.4 | 46 |
| 2026 TP6 | 2026-Oct-15 | 0.6 LD | 10.3 | 13 |
| 2026 UA | 2026-Oct-15 | 3.5 LD | 16.8 | 17 |
| 2026 TF4 | 2026-Oct-15 | 7.1 LD | 4.9 | 11 |
| 2026 UG | 2026-Oct-15 | 5 LD | 8.5 | 13 |
| 2022 UP6 | 2026-Oct-15 | 2.6 LD | 9 | 8 |
| 2026 UB | 2026-Oct-15 | 6.5 LD | 16.3 | 20 |
| 2000 SZ162 | 2026-Oct-16 | 19.9 LD | 5.7 | 12 |
| 2026 TE2 | 2026-Oct-16 | 6 LD | 14.7 | 25 |
| 2026 TB2 | 2026-Oct-16 | 5 LD | 8.8 | 32 |
| 2026 TA94 | 2026-Oct-16 | 5.4 LD | 7.4 | 13 |
| 2026 TC94 | 2026-Oct-18 | 6.6 LD | 10.5 | 15 |
| 2026 UL | 2026-Oct-18 | 1.8 LD | 12.9 | 36 |
| 2026 TS | 2026-Oct-18 | 2.4 LD | 10.3 | 55 |
| 2026 UF | 2026-Oct-18 | 6.8 LD | 7.6 | 35 |
| 2026 TN67 | 2026-Oct-18 | 16.6 LD | 6.9 | 28 |
| 2026 UK | 2026-Oct-19 | 7.6 LD | 15.1 | 35 |
| 2026 TD2 | 2026-Oct-20 | 7.3 LD | 12.3 | 44 |
| 2026 TP | 2026-Oct-20 | 12.1 LD | 9.9 | 51 |
| 2020 FN3 | 2026-Oct-20 | 12.4 LD | 5.8 | 45 |
| 2026 TM67 | 2026-Oct-20 | 11.7 LD | 14.3 | 54 |
| 2026 TV8 | 2026-Oct-21 | 4.8 LD | 9.2 | 25 |
| 2026 TU1 | 2026-Oct-22 | 12.8 LD | 7.9 | 25 |
| 2026 TX84 | 2026-Oct-22 | 10.6 LD | 7.4 | 23 |
| 2026 TK77 | 2026-Oct-22 | 9.7 LD | 6.2 | 15 |
| 2017 UX7 | 2026-Oct-22 | 17 LD | 10.3 | 27 |
| 2026 TV86 | 2026-Oct-23 | 5.6 LD | 5.7 | 18 |
| 2026 TR35 | 2026-Oct-23 | 15 LD | 21 | 52 |
| 2026 TT3 | 2026-Oct-24 | 12.8 LD | 12.8 | 46 |
| 2026 UE | 2026-Oct-25 | 5.2 LD | 15.9 | 25 |
| 2026 TB8 | 2026-Oct-25 | 7.1 LD | 7.8 | 60 |
| 2026 TB94 | 2026-Oct-27 | 5.1 LD | 11.6 | 27 |
| 2018 GS1 | 2026-Oct-28 | 11.1 LD | 9.3 | 108 |
| 2022 UV21 | 2026-Oct-29 | 14.8 LD | 9.6 | 13 |
| 2026 UD | 2026-Oct-30 | 11.7 LD | 7.7 | 27 |
| 2025 UK9 | 2026-Oct-31 | 0.8 LD | 7.8 | 4 |
| 524522 | 2026-Nov-02 | 15.7 LD | 8.7 | 277 |
| 2021 VC4 | 2026-Nov-03 | 6 LD | 11.2 | 15 |
| 2017 WJ2 | 2026-Nov-05 | 15.6 LD | 11.8 | 118 |
| 2016 VZ1 | 2026-Nov-05 | 20 LD | 13.5 | 21 |
| 2001 KF54 | 2026-Nov-06 | 18.9 LD | 16.4 | 391 |
| 2025 UF5 | 2026-Nov-09 | 18.9 LD | 1.9 | 10 |
| 2015 VH65 | 2026-Nov-10 | 9.7 LD | 8 | 10 |
| 2012 YD7 | 2026-Nov-10 | 18.6 LD | 7.5 | 49 |
| 2023 VF3 | 2026-Nov-11 | 8.5 LD | 8.8 | 19 |
| 2022 MP2 | 2026-Nov-13 | 19.8 LD | 3.8 | 23 |
| 2025 VG5 | 2026-Nov-13 | 18.2 LD | 4.9 | 16 |
| 2023 VE6 | 2026-Nov-17 | 18.4 LD | 10.1 | 13 |
| 2019 WT1 | 2026-Nov-18 | 19.7 LD | 9.7 | 16 |
| 2018 NE1 | 2026-Nov-19 | 16.7 LD | 13.3 | 74 |
| 2026 TB84 | 2026-Nov-20 | 12.2 LD | 9.8 | 67 |
| 2025 CP1 | 2026-Nov-30 | 12.9 LD | 10.8 | 6 |
| 2019 XF2 | 2026-Dec-04 | 3.1 LD | 10.2 | 14 |
| 2023 XH3 | 2026-Dec-06 | 18.7 LD | 16.5 | 14 |
| 2020 XC3 | 2026-Dec-08 | 14.5 LD | 14.3 | 110 |
| 2016 NV | 2026-Dec-08 | 14.3 LD | 10.4 | 379 |
| 2010 VQ | 2026-Dec-12 | 4.6 LD | 4.3 | 10 |
| 2025 XN6 | 2026-Dec-12 | 6.9 LD | 12.2 | 5 |
| 2026 LZ1 | 2026-Dec-14 | 14.4 LD | 11.2 | 36 |
Notes: LD means "Lunar Distance." 1 LD = 384,401 km, the distance between Earth and the Moon. 1 LD also equals 0.00256 AU. | | Cosmic Rays in the Atmosphere |
SPACE WEATHER BALLOON DATA: Almost once a week, Spaceweather.com and the students of Earth to Sky Calculus fly space weather balloons to the stratosphere over California. These balloons are equipped with sensors that detect secondary cosmic rays, a form of radiation from space that can penetrate all the way down to Earth's surface. Our monitoring program has been underway without interruption for 10 years, resulting in a unique dataset of in situ atmospheric measurements.
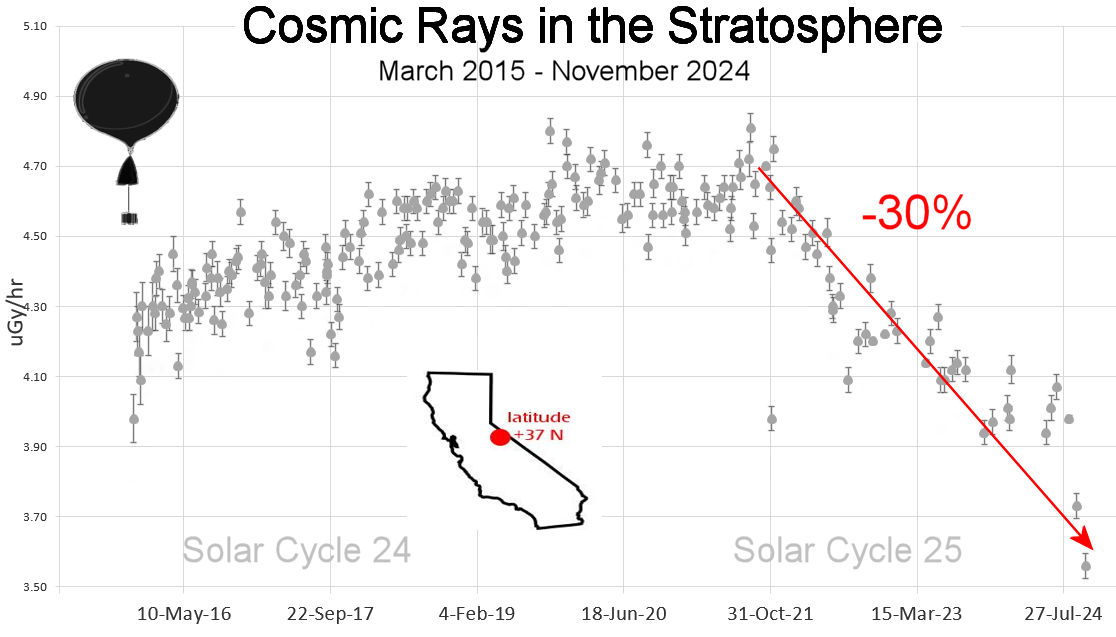
Latest results (Nov. 2024): Atmospheric radiation is sharply decreasing in 2024. Our latest measurements in November registered a 10-year low:
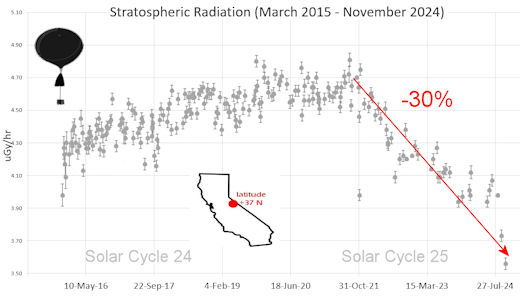
What's going on? Ironically, the radiation drop is caused by increasing solar activity. Solar Cycle 25 has roared to life faster than forecasters expected. The sun's strengthening and increasingly tangled magnetic field repels cosmic rays from deep space. In addition, solar coronal mass ejections (CMEs) sweep aside cosmic rays, causing sharp reductions called "Forbush Decreases." The two effects blend together to bring daily radiation levels down.
.Who cares? Cosmic rays are a surprisingly "down to Earth" form of space weather. They can alter the chemistry of the atmosphere, trigger lightning, and penetrate commercial airplanes. According to a study from the Harvard T.H. Chan school of public health, crews of aircraft have higher rates of cancer than the general population. The researchers listed cosmic rays, irregular sleep habits, and chemical contaminants as leading risk factors. A number of controversial studies (#1, #2, #3, #4) go even further, linking cosmic rays with cardiac arrhythmias and sudden cardiac death.
Technical notes: The radiation sensors onboard our helium balloons detect X-rays and gamma-rays in the energy range 10 keV to 20 MeV. These energies span the range of medical X-ray machines and airport security scanners.
Data points in the graph labeled "Stratospheric Radiation" correspond to the peak of the Regener-Pfotzer maximum, which lies about 67,000 feet above central California. When cosmic rays crash into Earth's atmosphere, they produce a spray of secondary particles that is most intense at the entrance to the stratosphere. Physicists Eric Regener and Georg Pfotzer discovered the maximum using balloons in the 1930s and it is what we are measuring today.
| | The official U.S. government space weather bureau |
| | The first place to look for information about sundogs, pillars, rainbows and related phenomena. |
| | Researchers call it a "Hubble for the sun." SDO is the most advanced solar observatory ever. |
| | 3D views of the sun from NASA's Solar and Terrestrial Relations Observatory |
| | Realtime and archival images of the Sun from SOHO. |
| | information about sunspots based on the latest NOAA/USAF Active Region Summary |
| | current counts of failed and deployed Starlink satellites from Jonathan's Space Page. See also, all satellite statistics. |
| | Authoritative predictions of space junk and satellite re-entries |
| | from the NOAA Space Environment Center |
| | fun to read, but should be taken with a grain of salt! Forecasts looking ahead more than a few days are often wrong. |
| | from the NOAA Space Environment Center |
| | the underlying science of space weather |
 | Got a chipped or cracked windshield that prevents you from seeing space weather events while driving? Get windshield replacement from SR Windows & Glass with free mobile auto glass service anywhere in the Phoenix area. |
| | These links help Spaceweather.com stay online. Thank you to our supporters! |
| | | | | | |