Lights Over Lapland has a brand-new website full of exciting adventures in Abisko National Park, Sweden! Take a look at our aurora activities and book your once-in-a-lifetime trip with us today! | | |
THE CHILL OF SOLAR MINIMUM: The sun is entering one of the deepest Solar Minima of the Space Age. Sunspots have been absent for most of 2018, and the sun's ultraviolet output has sharply dropped. New research shows that Earth's upper atmosphere is responding.
"We see a cooling trend," says Martin Mlynczak of NASA's Langley Research Center. "High above Earth's surface near the edge of space, our atmosphere is losing heat energy. If current trends continue, the upper atmosphere could soon set a Space Age record for cold."
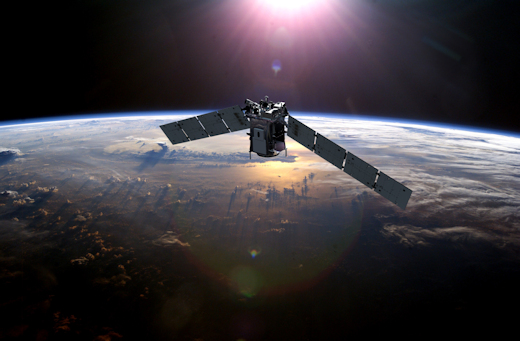
Above: The TIMED satellite monitoring the temperature of the upper atmosphere
These results come from the SABER instrument onboard NASA's TIMED satellite. SABER monitors infrared emissions from carbon dioxide (CO2) and nitric oxide (NO), two substances that play a key role in the energy balance of air 100 to 300 kilometers above our planet's surface. By measuring the infrared glow of these molecules, SABER can assess the thermal state of gas at the very top of the atmosphere–a layer researchers call "the thermosphere."
"The thermosphere always cools off during Solar Minimum. It's one of the most important ways the 11-year solar cycle affects our planet," explains Mlynczak, the associate principal investigator for SABER.
When the thermosphere cools, it shrinks, literally decreasing the radius of the atmosphere. This shrinkage decreases aerodynamic drag on satellites in low-Earth orbit, extending their lifetimes. That's the good news. The bad news is, it also delays the natural decay of space junk, resulting in a more cluttered environment around Earth.
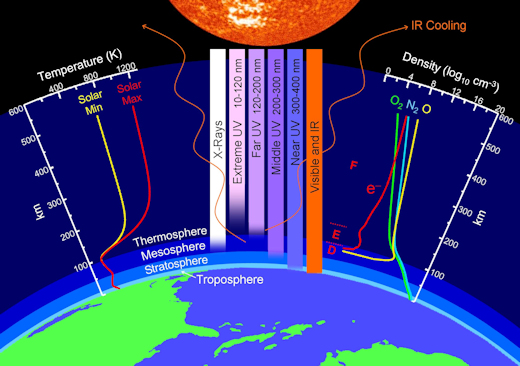
Above: Layers of the atmosphere. The cooling measured by SABER is happening in the thermosphere.
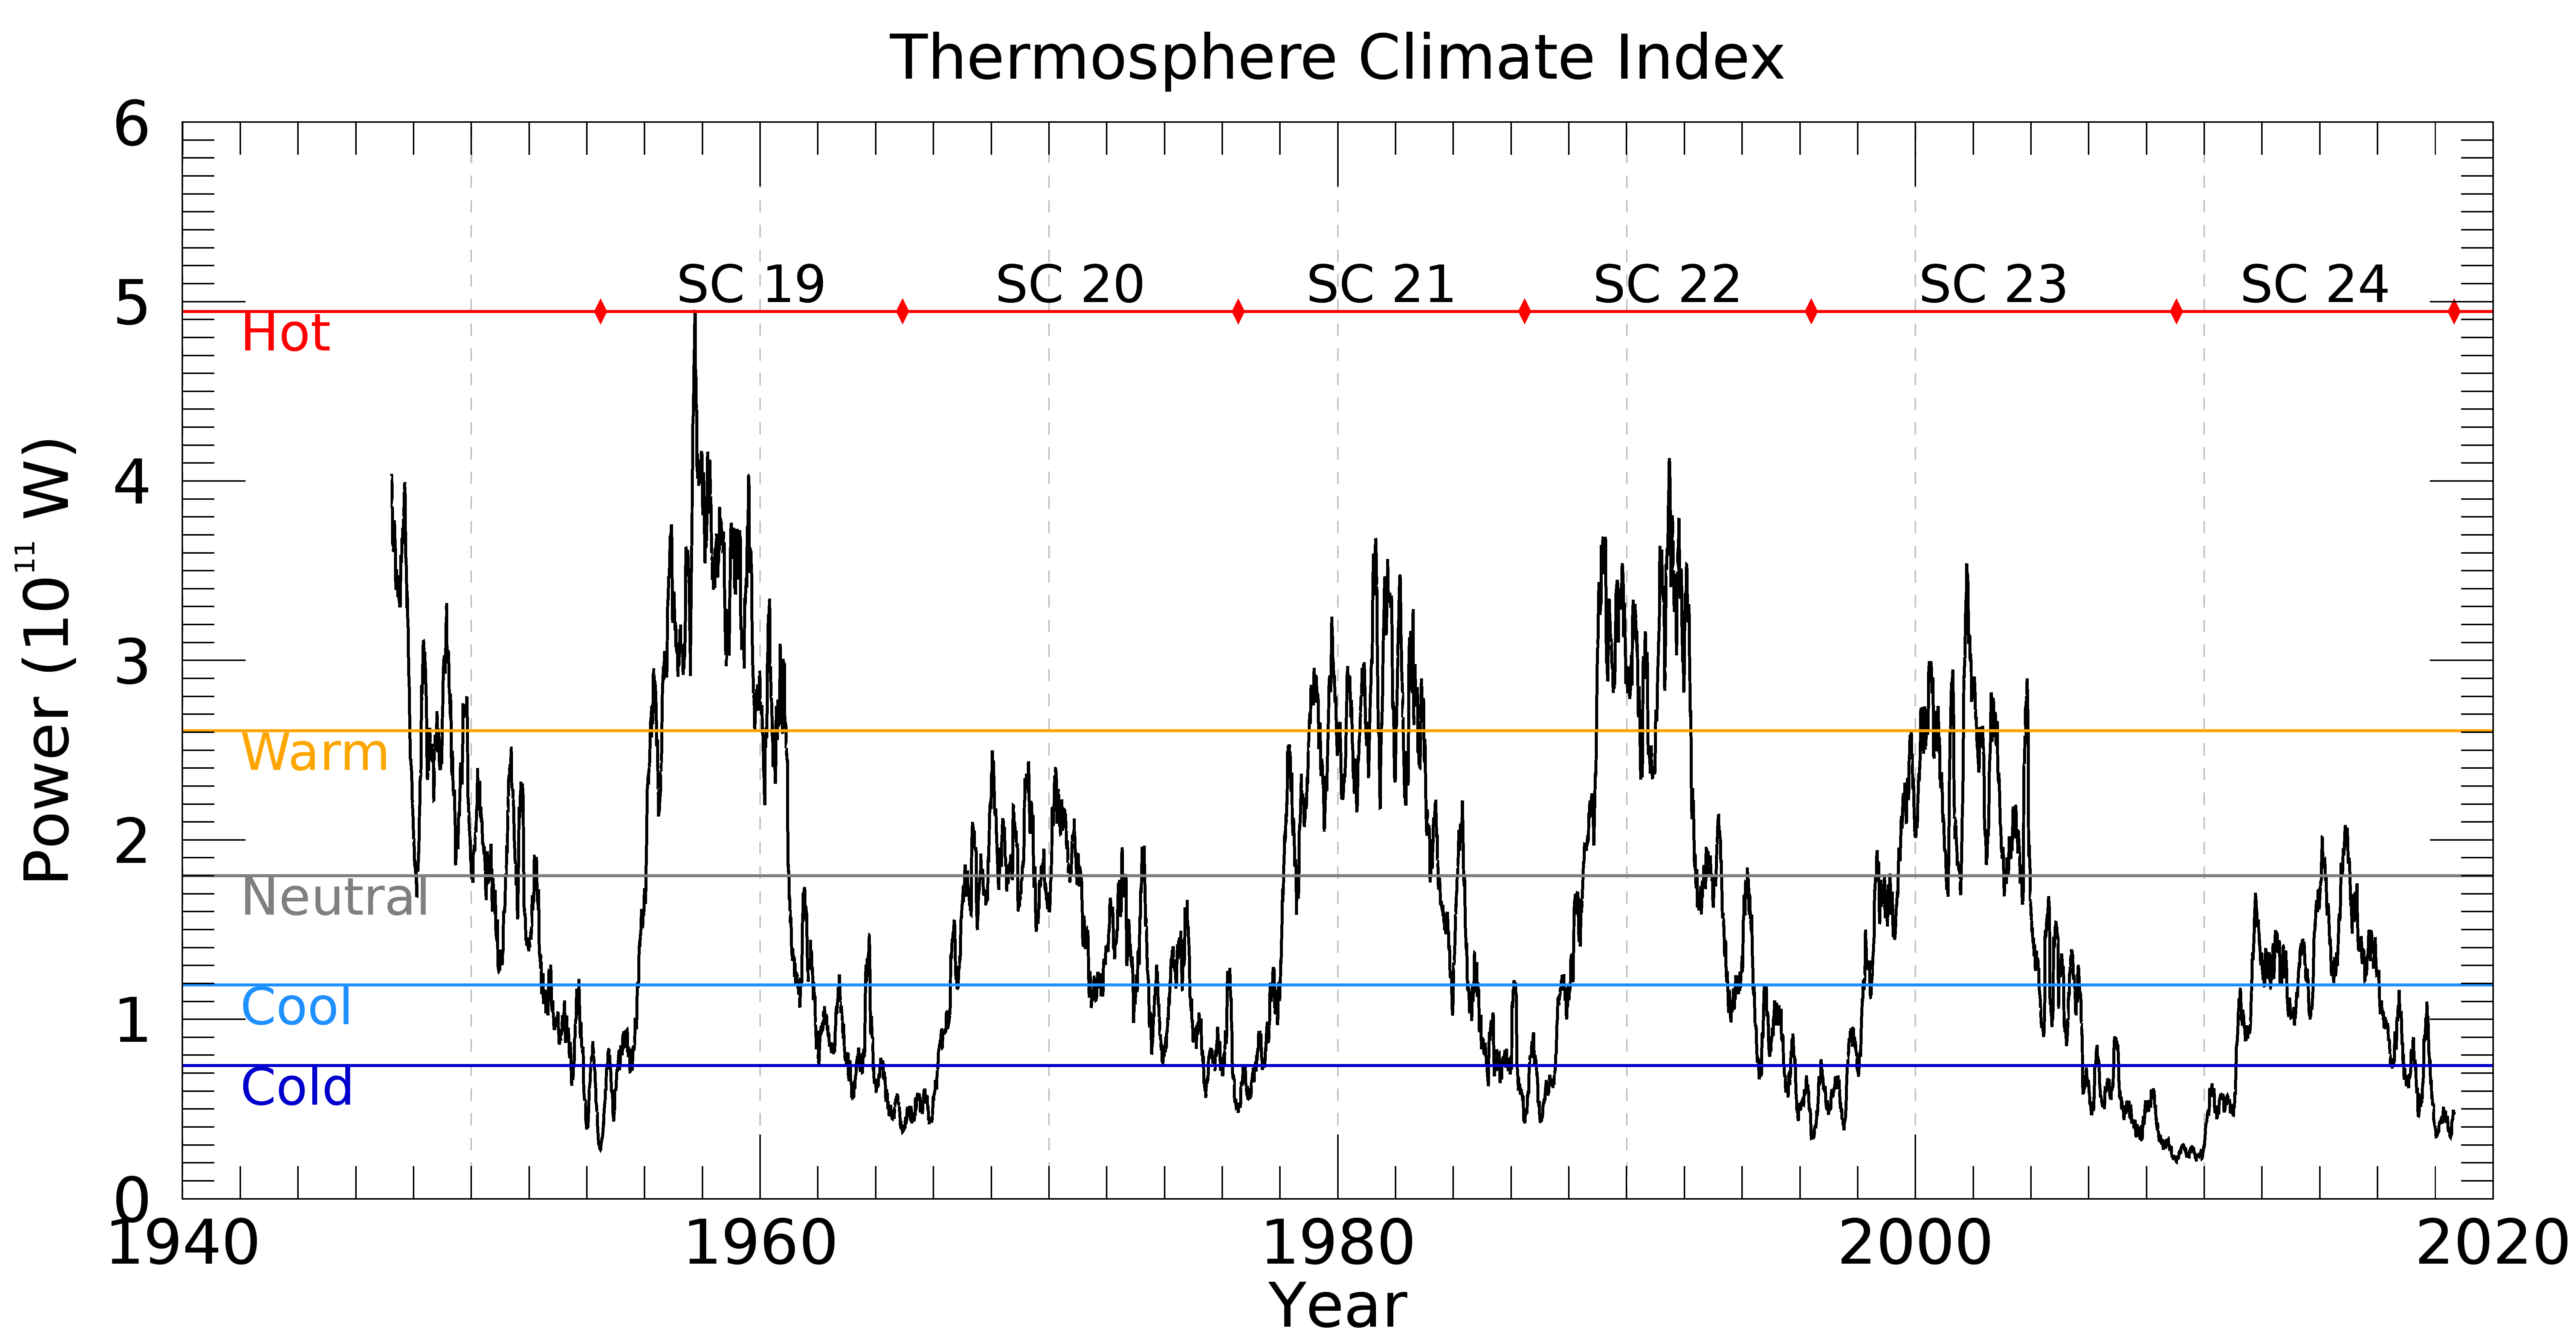
To help keep track of what's happening in the thermosphere, Mlynczak and colleagues recently introduced the "Thermosphere Climate Index" (TCI)–a number expressed in Watts that tells how much heat NO molecules are dumping into space. During Solar Maximum, the TCI is high ("Hot"); during Solar Minimum, it is low ("Cold").
"Right now, it is very low indeed," says Mlynczak. "SABER is currently measuring 33 billion Watts of infrared power from NO. That's 10 times smaller than we see during more active phases of the solar cycle."
Although SABER has been in orbit for only 17 years, Mlynczak and colleagues recently calculated TCI going all the way back to the 1940s. "SABER taught us to do this by revealing how TCI depends on other variables such as geomagnetic activity and the sun's UV output–things we have been measuring for decades," he explains. The historical record shows a strong correlation between TCI and the solar cycle:
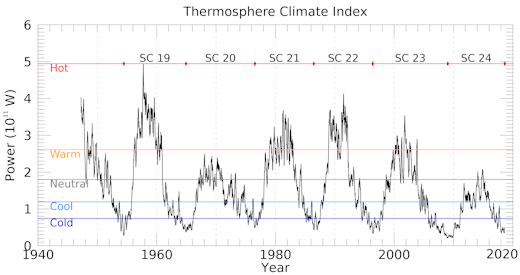
Above: Recent studies by Mlynczak et al show that the state of the thermosphere varies with the solar cycle and may be discussed using a set of five plain language terms: Cold, Cool, Neutral, Warm, and Hot. [more]
As 2018 comes to an end, the thermosphere is on the verge of setting a Space Age record for Cold. "We're not there quite yet," says Mlynczak, "but it could happen in a matter of months."
Soon, the Thermosphere Climate Index will be added to Spaceweather.com as a regular data feed, so our readers can monitor the state of the upper atmosphere just as researchers do. Stay tuned.
An expanded and sharable version of this story is available here.
Realtime Space Weather Photo Gallery
WHERE NO CRYSTAL SPACESHIP HAS GONE BEFORE: On Sept. 24, 2018, the students of Earth to Sky Calculus launched the starship Enterprise to the stratosphere. Riding onboard a high-altitude cosmic ray balloon, the laser-etched crystal spaceship traveled 34.7 km (113,845 feet) above Earth's surface:
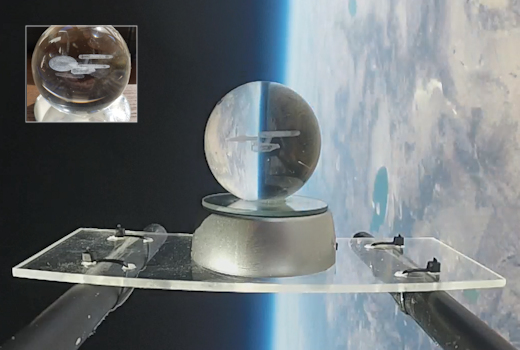
You can have it for $149.95. The students are selling the Enterprise to support their cosmic ray ballooning program. Each starship comes with a greeting card showing the item in flight and telling the story of its journey to the edge of space. Also included is a multi-colored LED illuminated stand (shown in the picture above). This creates a colorful visual effect and allows the Enterprise to be used as a far-out night light.
Far Out Gifts: Earth to Sky Store
All sales support hands-on STEM education
Realtime Aurora Photo Gallery
Every night, a network of
NASA all-sky cameras scans the skies above the United States for meteoritic fireballs. Automated software maintained by NASA's Meteoroid Environment Office calculates their orbits, velocity, penetration depth in Earth's atmosphere and many other characteristics. Daily results are presented here on Spaceweather.com.
On Sep. 28, 2018, the network reported 40 fireballs.
(40 sporadics)
In this diagram of the inner solar system, all of the fireball orbits intersect at a single point--Earth. The orbits are color-coded by velocity, from slow (red) to fast (blue). [Larger image] [movies]
Potentially Hazardous Asteroids (
PHAs) are space rocks larger than approximately 100m that can come closer to Earth than 0.05 AU. None of the known PHAs is on a collision course with our planet, although astronomers are finding
new ones all the time.
On September 28, 2018 there were 1923 potentially hazardous asteroids.
 |
Recent & Upcoming Earth-asteroid encounters: | Asteroid | Date(UT) | Miss Distance | Velocity (km/s) | Diameter (m) |
| 2018 ST1 | 2018-Sep-24 | 4.3 LD | 12.1 | 34 |
| 2018 RQ1 | 2018-Sep-24 | 4.1 LD | 3.1 | 54 |
| 2018 SK | 2018-Sep-25 | 13.1 LD | 7.7 | 25 |
| 2018 SS1 | 2018-Sep-27 | 6.5 LD | 14.3 | 65 |
| 2018 SM1 | 2018-Sep-27 | 6.8 LD | 5.5 | 94 |
| 2018 SP1 | 2018-Oct-04 | 15.3 LD | 16.8 | 93 |
| 2018 EB | 2018-Oct-07 | 15.5 LD | 15.1 | 155 |
| 2014 US7 | 2018-Oct-17 | 3.2 LD | 8.7 | 19 |
| 2013 UG1 | 2018-Oct-18 | 10.4 LD | 13.4 | 123 |
| 2016 GC221 | 2018-Oct-18 | 8.7 LD | 14.4 | 39 |
| 475534 | 2018-Oct-29 | 7.5 LD | 18.1 | 204 |
| 2002 VE68 | 2018-Nov-04 | 14.7 LD | 8.6 | 282 |
| 2010 VQ | 2018-Nov-07 | 15.6 LD | 3.8 | 10 |
| 2009 WB105 | 2018-Nov-25 | 15.2 LD | 18.9 | 71 |
Notes: LD means "Lunar Distance." 1 LD = 384,401 km, the distance between Earth and the Moon. 1 LD also equals 0.00256 AU. MAG is the visual magnitude of the asteroid on the date of closest approach. | | Cosmic Rays in the Atmosphere |
SOMETHING NEW! We have developed a new predictive model of aviation radiation. It's called E-RAD--short for Empirical RADiation model. We are constantly flying radiation sensors onboard airplanes over the US and and around the world, so far collecting more than 22,000 gps-tagged radiation measurements. Using this unique dataset, we can predict the dosage on any flight over the USA with an error no worse than 15%.
E-RAD lets us do something new: Every day we monitor approximately 1400 flights criss-crossing the 10 busiest routes in the continental USA. Typically, this includes more than 80,000 passengers per day. E-RAD calculates the radiation exposure for every single flight.
The Hot Flights Table is a daily summary of these calculations. It shows the 5 charter flights with the highest dose rates; the 5 commercial flights with the highest dose rates; 5 commercial flights with near-average dose rates; and the 5 commercial flights with the lowest dose rates. Passengers typically experience dose rates that are 20 to 70 times higher than natural radiation at sea level.
To measure radiation on airplanes, we use the same sensors we fly to the stratosphere onboard Earth to Sky Calculus cosmic ray balloons: neutron bubble chambers and X-ray/gamma-ray Geiger tubes sensitive to energies between 10 keV and 20 MeV. These energies span the range of medical X-ray machines and airport security scanners.
Column definitions: (1) The flight number; (2) The maximum dose rate during the flight, expressed in units of natural radiation at sea level; (3) The maximum altitude of the plane in feet above sea level; (4) Departure city; (5) Arrival city; (6) Duration of the flight.
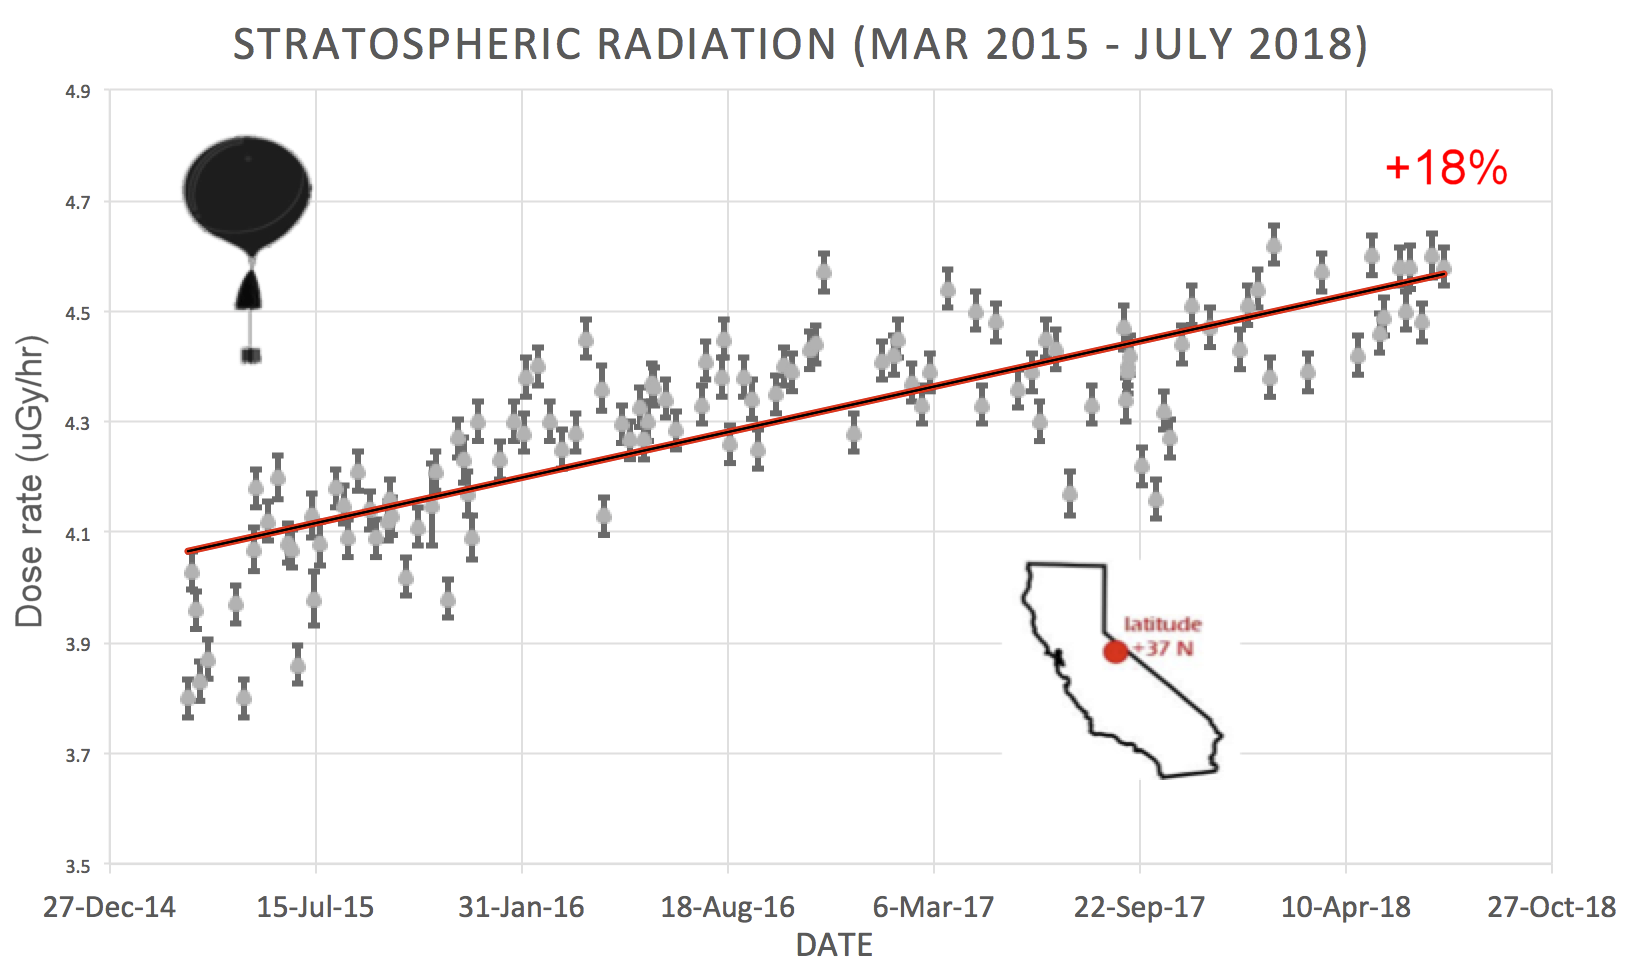
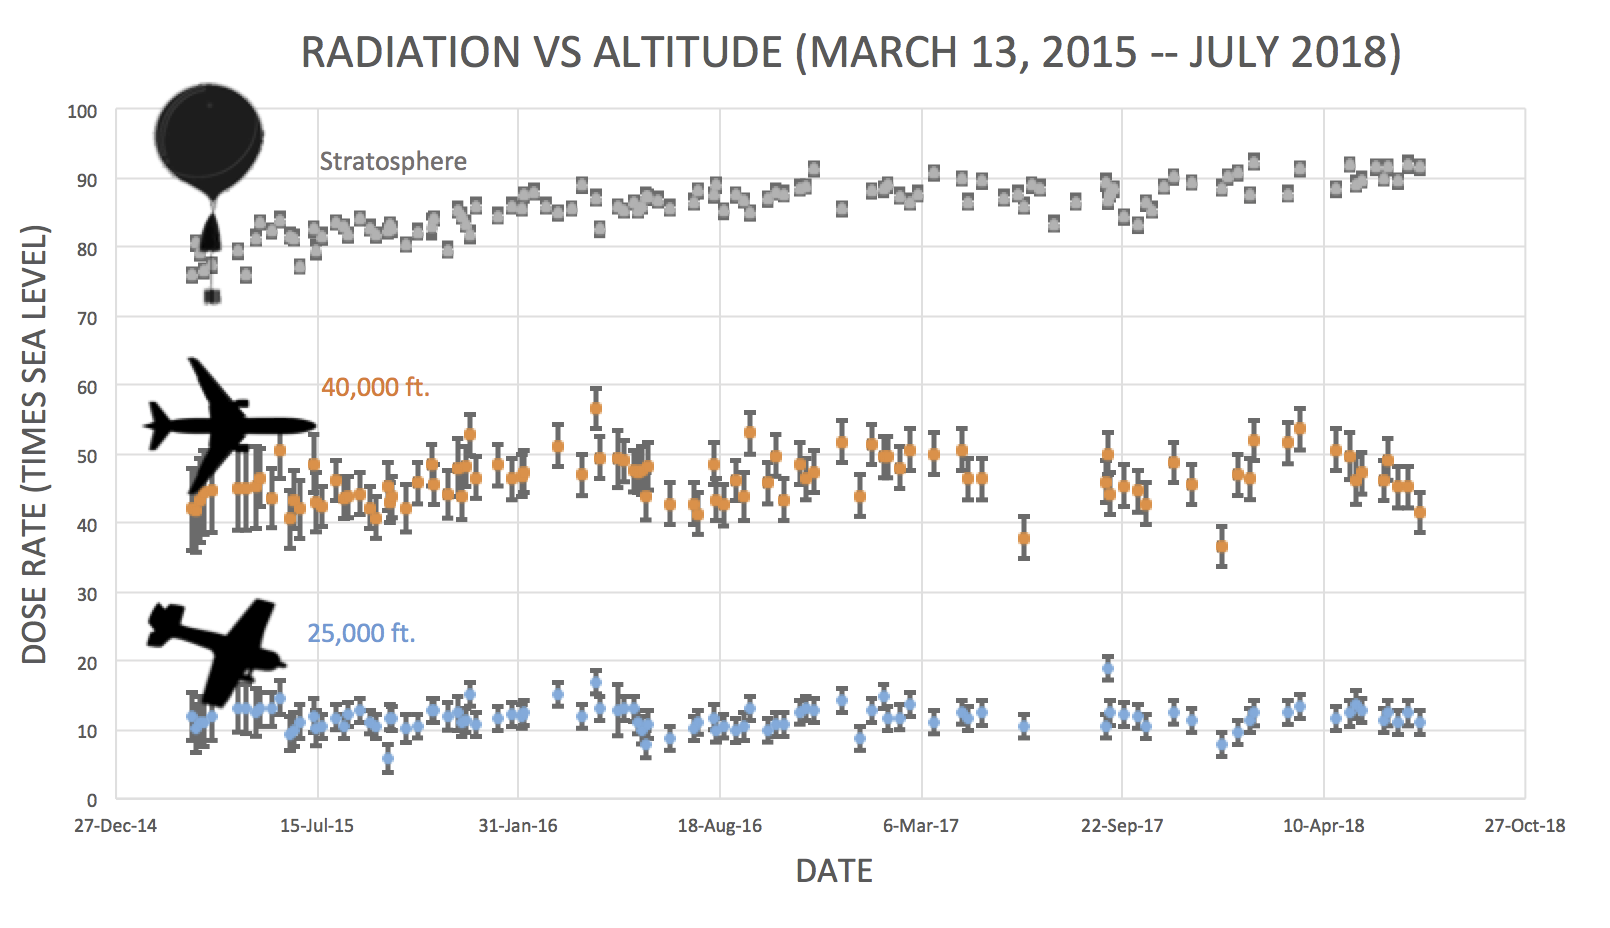
SPACE WEATHER BALLOON DATA: Approximately once a week, Spaceweather.com and the students of Earth to Sky Calculus fly space weather balloons to the stratosphere over California. These balloons are equipped with radiation sensors that detect cosmic rays, a surprisingly "down to Earth" form of space weather. Cosmic rays can seed clouds, trigger lightning, and penetrate commercial airplanes. Furthermore, there are studies ( #1, #2, #3, #4) linking cosmic rays with cardiac arrhythmias and sudden cardiac death in the general population. Our latest measurements show that cosmic rays are intensifying, with an increase of more than 18% since 2015:
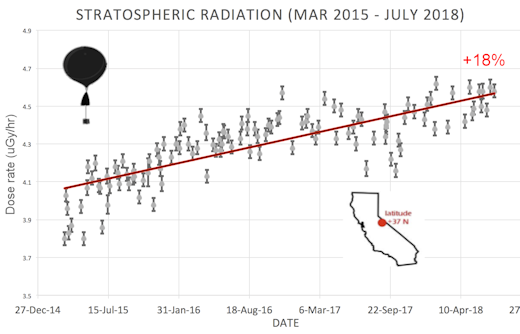
The data points in the graph above correspond to the peak of the Reneger-Pfotzer maximum, which lies about 67,000 feet above central California. When cosmic rays crash into Earth's atmosphere, they produce a spray of secondary particles that is most intense at the entrance to the stratosphere. Physicists Eric Reneger and Georg Pfotzer discovered the maximum using balloons in the 1930s and it is what we are measuring today.
En route to the stratosphere, our sensors also pass through aviation altitudes:
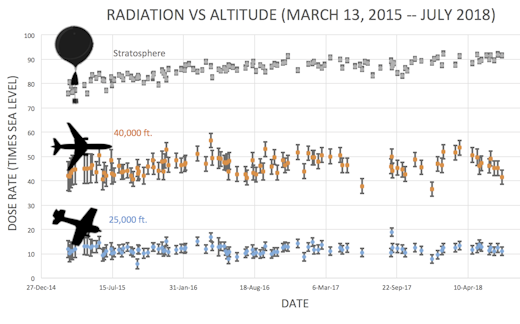
In this plot, dose rates are expessed as multiples of sea level. For instance, we see that boarding a plane that flies at 25,000 feet exposes passengers to dose rates ~10x higher than sea level. At 40,000 feet, the multiplier is closer to 50x.
The radiation sensors onboard our helium balloons detect X-rays and gamma-rays in the energy range 10 keV to 20 MeV. These energies span the range of medical X-ray machines and airport security scanners.
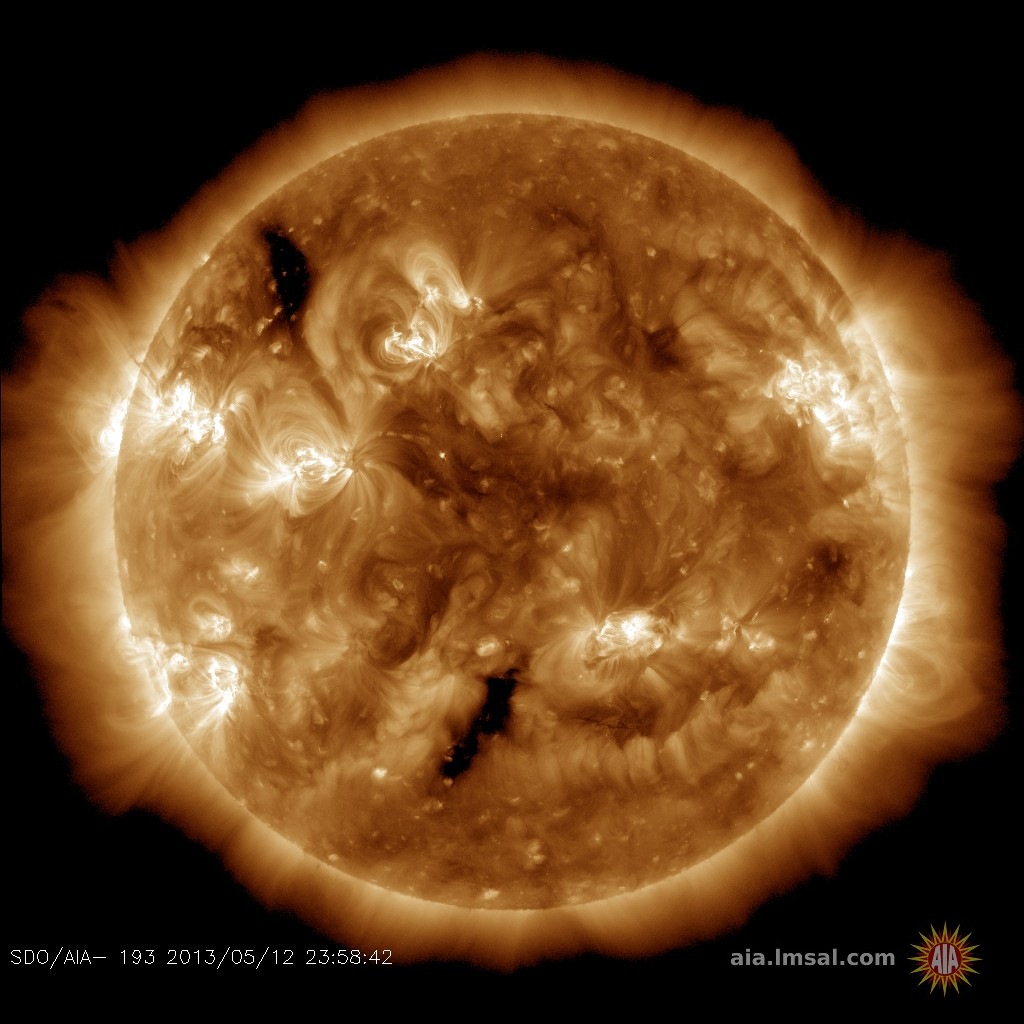
Why are cosmic rays intensifying? The main reason is the sun. Solar storm clouds such as coronal mass ejections (CMEs) sweep aside cosmic rays when they pass by Earth. During Solar Maximum, CMEs are abundant and cosmic rays are held at bay. Now, however, the solar cycle is swinging toward Solar Minimum, allowing cosmic rays to return. Another reason could be the weakening of Earth's magnetic field, which helps protect us from deep-space radiation.
| | The official U.S. government space weather bureau |
| | The first place to look for information about sundogs, pillars, rainbows and related phenomena. |
| | Researchers call it a "Hubble for the sun." SDO is the most advanced solar observatory ever. |
| | 3D views of the sun from NASA's Solar and Terrestrial Relations Observatory |
| | Realtime and archival images of the Sun from SOHO. |
| | from the NOAA Space Environment Center |
| | fun to read, but should be taken with a grain of salt! Forecasts looking ahead more than a few days are often wrong. |
| | from the NOAA Space Environment Center |
| | the underlying science of space weather |
 | If you are a Youtuber and want to buy real Youtube views than try out Buyrealsocial.com for the best results possible! |
| To find reviews of new online casino sites in the UK try The Casino DB where there are hundreds of online casino reviews complete with bonuses and ratings. |
| | These links help Spaceweather.com stay online. Thank you to our supporters! |
| | | | | | |


