Spotless Days Current Stretch: 0 days 2017 total: 81 days (25%) 2016 total: 32 days (9%) 2015 total: 0 days (0%) 2014 total: 1 day (<1%) 2013 total: 0 days (0%) 2012 total: 0 days (0%) 2011 total: 2 days (<1%) 2010 total: 51 days (14%) 2009 total: 260 days (71%) Updated 18 Nov 2017
Geomagnetic Storms: Probabilities for significant disturbances in Earth's magnetic field are given for three activity levels: active, minor storm, severe storm
Updated at: 2017 Nov 18 2200 UTC
Mid-latitudes
0-24 hr
24-48 hr
ACTIVE
40 %
40 %
MINOR
15 %
20 %
SEVERE
01 %
01 %
High latitudes
0-24 hr
24-48 hr
ACTIVE
20 %
15 %
MINOR
30 %
30 %
SEVERE
35 %
40 %
Saturday, Nov. 18, 2017
What's up in space
All-inclusive Northern Lights trips in Tromsø, Norway. Small groups, big experiences! Highly qualified guides ensure unique and unforgettable adventures with a personal touch. Visit Explore the Arctic
SOLAR WIND, INCOMING: Today, a hole in the sun's atmosphere is facing Earth. An emerging stream of solar wind could reach our planet as early as Nov. 19th, with G1-class geomagnetic storms possible on Nov. 20th when Earth moves deeper into the gaseous material. Arctic sky watchers should be alert for auroras on Sunday and Monday. Free:Aurora Alerts.
NEW ATMOSPHERIC RADIATION DATA: Last week's double launch of space weather balloons over Mexico and California was a success. The goal of our experiment was to measure cosmic rays in the atmosphere above both countries and compare the results. A first look at the data reveal big differences.
These curves show dose rate vs. altitude. They diverge rapidly above 15,000 feet, with radiation levels over central California typically 1.5 times higher than over Mexico. This means air travelers over California can expect to receive significantly greater doses of cosmic radiation compared to their counterparts flying south of the border. In both places, radiation levels reached a peak in the stratosphere. At those altitudes, dose rates were 60 times greater than sea level for Mexico, 90 times greater than sea level for California.
The reason for these differences is Earth's magnetic field which, generally speaking, provides greater shielding against cosmic rays near the equator (Mexico) than at mid-latitudes (California)
The radiation sensors onboard our helium balloons detect X-rays and gamma-rays in the energy range 10 keV to 20 MeV. These energies span the range of medical X-ray machines and airport security scanners. They trace secondary cosmic rays, the spray of debris created when primary cosmic rays from deep space hit the top of Earth's atmosphere.
Our payloads also carried neutron sensors. Stay tuned for updates next week as we continue our analysis of data from those detectors.
ARCTIC METEOR TURNS NIGHT INTO DAY: On the evening of Nov. 16th, aurora tour guide Tony Bateman of northern Finland was indoors, warming up between auroras, when his surroundings began to vibrate. "There was a huge bang and the cottage shook violently," he reports. "At first I thought it was an earthquake. Or maybe a tree fell on the cottage roof! I walked outside and inspected the trees. Everything looked okay." A quick replay of his aurora webcam solved the mystery. "It was an incredible meteor," he says.
"It gave me goosebumps to see the night sky turn blue as the meteor exploded," he says. "Auroras and a fireball--what a night!"
This week Earth has been moving through a stream of debris from Comet Encke, source of the annual Taurid meteor shower. Taurids are rich in fireballs. However, the trajectory of this meteor suggests it was no Taurid.
It appears to have been a sporadic--that is, a random meteor from no particular comet. Every day, Earth is peppered with sporadic meteors from a diffuse swarm filling the inner solar system. NASA statistics show that sporadic fireballs as bright as Venus appear somewhere on Earth more than 100 times daily. Fireballs as bright as a quarter Moon occur once every ten days, and fireballs as bright as a full Moon once every few months or so. The Arctic fireball of Nov. 16th belongs in the rarest of those three categories--a lucky catch, indeed.
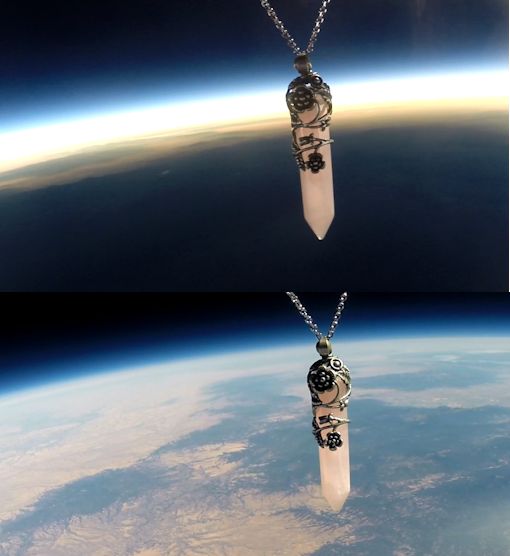
CHRISTMAS GIFTS FROM SPACE: On Aug. 21st during the Great American Solar Eclipse, the students of Earth to Sky Calculus launched 11 space weather balloons from the path of totality. They aimed to photograph the Moon's shadow from the stratosphere--and they succeeded. As a fundraiser, some of the balloons carried jewelry, like this rose quartz pendant shown entering the Moon's shadow more than 90,000 feet above Oregon:
During the 2.5 hour flight, the pendants were wrapped in the Moon's shadow for more than two minutes, experiencing a spooky darkness colder than -50 C.
You can have one for $169.95. Each crystal pendant comes with a unique gift card showing the jewelry passing through the Moon's shadow and floating at the top of Earth's atmosphere. The interior of the card tells the story of the flight and confirms that this gift has been to the edge of space and back again.
Every night, a network of NASA all-sky cameras scans the skies above the United States for meteoritic fireballs. Automated software maintained by NASA's Meteoroid Environment Office calculates their orbits, velocity, penetration depth in Earth's atmosphere and many other characteristics. Daily results are presented here on Spaceweather.com.
In this diagram of the inner solar system, all of the fireball orbits intersect at a single point--Earth. The orbits are color-coded by velocity, from slow (red) to fast (blue). [Larger image] [movies]
Near Earth Asteroids
Potentially Hazardous Asteroids (PHAs) are space rocks larger than approximately 100m that can come closer to Earth than 0.05 AU. None of the known PHAs is on a collision course with our planet, although astronomers are finding new ones all the time.
On November 18, 2017 there were 1853 potentially hazardous asteroids.
Notes: LD means "Lunar Distance." 1 LD = 384,401 km, the distance between Earth and the Moon. 1 LD also equals 0.00256 AU. MAG is the visual magnitude of the asteroid on the date of closest approach.
Cosmic Rays in the Atmosphere
Readers, thank you for your patience while we continue to develop this new section of Spaceweather.com. We've been working to streamline our data reduction, allowing us to post results from balloon flights much more rapidly, and we have developed a new data product, shown here:
This plot displays radiation measurements not only in the stratosphere, but also at aviation altitudes. Dose rates are expessed as multiples of sea level. For instance, we see that boarding a plane that flies at 25,000 feet exposes passengers to dose rates ~10x higher than sea level. At 40,000 feet, the multiplier is closer to 50x. These measurements are made by our usual cosmic ray payload as it passes through aviation altitudes en route to the stratosphere over California.
What is this all about? Approximately once a week, Spaceweather.com and the students of Earth to Sky Calculus fly space weather balloons to the stratosphere over California. These balloons are equipped with radiation sensors that detect cosmic rays, a surprisingly "down to Earth" form of space weather. Cosmic rays can seed clouds, trigger lightning, and penetrate commercial airplanes. Furthermore, there are studies ( #1, #2, #3, #4) linking cosmic rays with cardiac arrhythmias and sudden cardiac death in the general population. Our latest measurements show that cosmic rays are intensifying, with an increase of more than 13% since 2015:
Why are cosmic rays intensifying? The main reason is the sun. Solar storm clouds such as coronal mass ejections (CMEs) sweep aside cosmic rays when they pass by Earth. During Solar Maximum, CMEs are abundant and cosmic rays are held at bay. Now, however, the solar cycle is swinging toward Solar Minimum, allowing cosmic rays to return. Another reason could be the weakening of Earth's magnetic field, which helps protect us from deep-space radiation.
The radiation sensors onboard our helium balloons detect X-rays and gamma-rays in the energy range 10 keV to 20 MeV. These energies span the range of medical X-ray machines and airport security scanners.
The data points in the graph above correspond to the peak of the Reneger-Pfotzer maximum, which lies about 67,000 feet above central California. When cosmic rays crash into Earth's atmosphere, they produce a spray of secondary particles that is most intense at the entrance to the stratosphere. Physicists Eric Reneger and Georg Pfotzer discovered the maximum using balloons in the 1930s and it is what we are measuring today.


