Solar minimum is here - but even now strangely beautiful auroras are dancing around the poles. Deep inside the Arctic Circle, the expert guides of Aurora Holidays in Utsjoki, Finland, can help you chase them. Book now! | | |
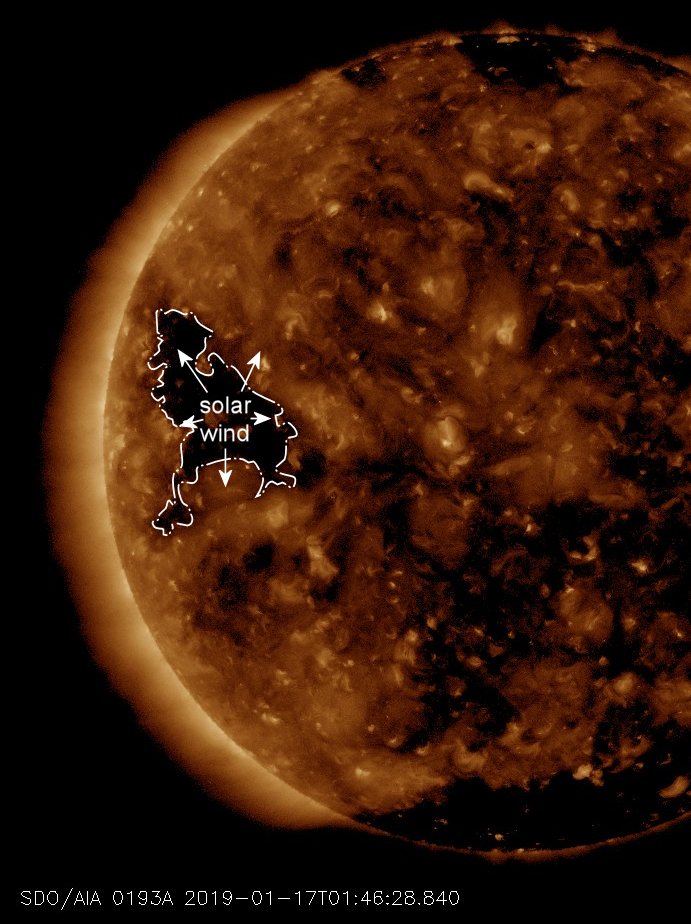
A HOLE IN THE SUN'S ATMOSPHERE: Minor geomagnetic storms are possible on Jan. 23rd and 24th when a stream of solar wind is expected to hit Earth's magnetic field. The gaseous material is flowing from an equatorial hole in the sun's atmosphere. Aurora Alerts: SMS text, email.
EARTH'S SHIFTING MAGNETIC POLES ARE CONFUSING YOUR PHONE: Pick up your cell phone and look at it. That rectangular marvel of modern technology contains thousands of lines of code. Among them is the World Magnetic Model (WMM)–a program that helps your phone navigate. And it's in a bit of trouble. Researchers have announced that the WMM needs an emergency update because Earth's magnetic field is changing.
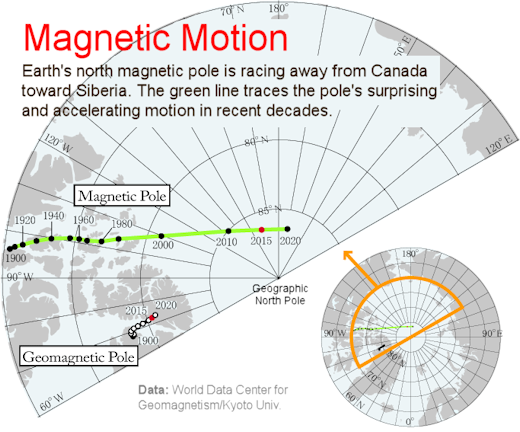
Savvy backcountry hikers have long known that compass needles don't really point north. The magnetic north pole is displaced hundreds of miles from the true north pole and, to make matters worse, it wanders unpredictably from year to year. To find true north in the continental USA, you have to correct compass directions by as much as 20 degrees using a special "declination table."
The World Magnetic Model is a computer program that makes this correction for you. It improves the navigation of devices ranging from nuclear submarines to common smartphones.
"The WMM is the standard magnetic model used for navigation by organizations such as NATO, the Ministry of Defence, and the US Department of Defense, and also by smartphone operating systems such as Android and iOS," explains Will Brown of the British Geological Survey's Geomagnetism Team, which produces the model in collaboration with NOAA of the USA.
"When you open your smartphone's map app, you may see an arrow pointing which way you're facing, and there's something quite clever going on underneath," he continues. "Your phone contains a magnetometer that is measuring the Earth's magnetic field. In order to make sense of this information, Android and iOS operating systems use the WMM to correct the measurements to true north."
Normally the World Magnetic Model is updated every 5 years. For decades that's been often enough to track natural changes in our planet's magnetism caused by fluctuations in Earth's molten core. But suddenly things are changing faster than before.
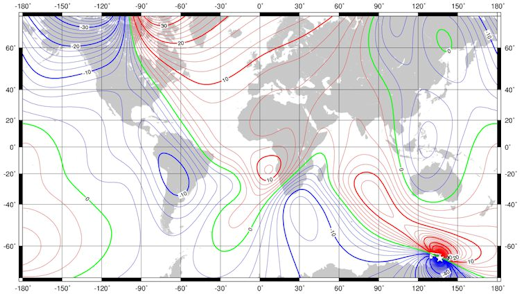
Annual rate of change of declination for 2015.0 to 2020.0 from the World Magnetic Model (WMM2015).
"Since late 2014, Earth's core field has varied in an unpredicted, and currently unpredictable, manner [including a sudden change in declinaton called a 'geomagnetic jerk' in 2014/2015]," says Brown. "The aim of the WMM is to be globally accurate within 1 degree of declination, but we were going to exceed that limit in only 3 years." That's why, for the first time, they are issuing an update to the WMM before the usual 5 year mark in 2020.
The new model is based data from a global network of 160 surface observatories and satellites in low-Earth orbit such as ESA's Swarm mission. It was supposed to be released on Jan. 15th but has been delayed until Jan. 30th because of the partial shutdown of the US government.
A sharable permalink to this story may be found here.
Realtime Space Weather Photo Gallery
FAR OUT VALENTINE'S GIFT: Valentine's Day is less than one month away. Nothing says "I love you" like a heart-shaped pendant from the edge of space. On Nov. 14, 2018, the students of Earth to Sky Calculus launched this premium Swarovski crystal onboard a cosmic ray balloon, and it flew 110,520 feet above the Sierra Nevada mountains of California:
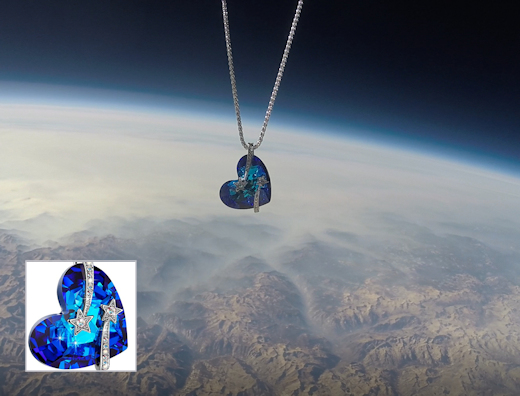
You can have it for $199.95. The blue heart is cradled inside a pair of sterling silver shooting stars and, on the back, is engraved "I ♥ u to the moon and back". Each pendant comes with a greeting card showing the jewelry in flight and telling the story of its trip to the stratosphere.
Far Out Gifts: Earth to Sky Store
All sales support hands-on STEM education
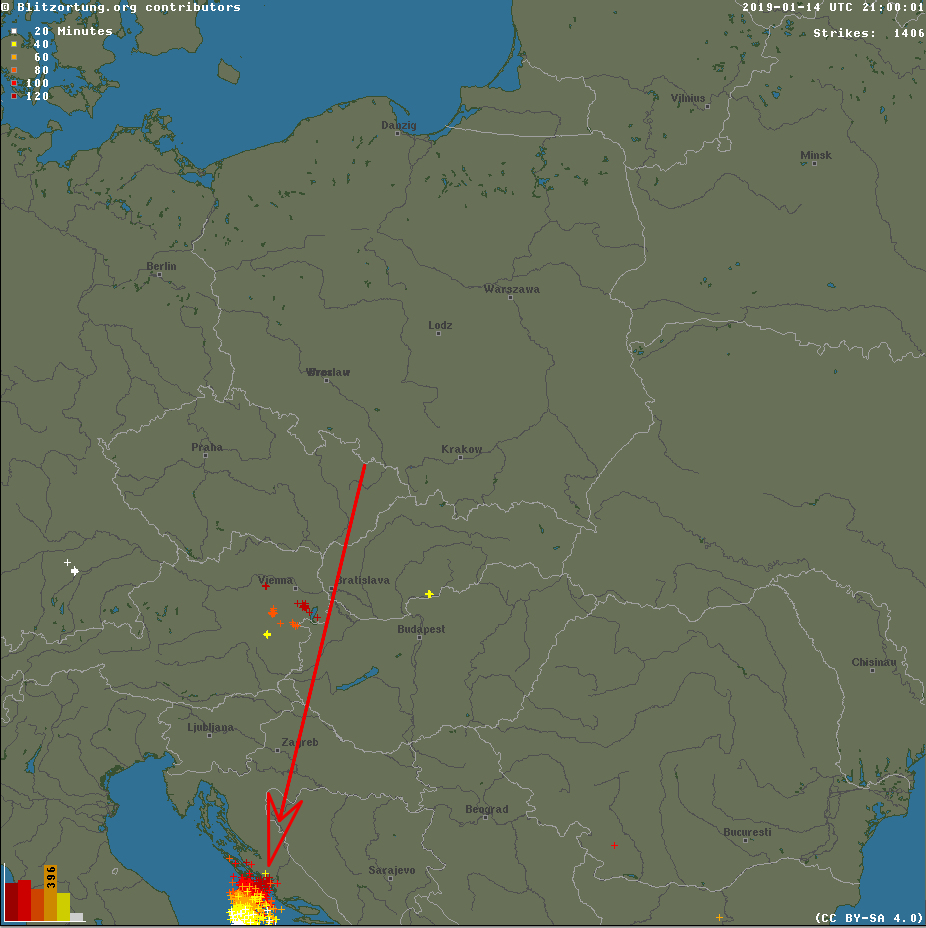
WINTER SPRITES: Summer is the season for sprites. The strange red forms shoot up from the tops of intense thunderstorms, tapping the heat energy of the atmosphere to create exotic upward-directed lightning. So it came as a bit of a surprise on the night of Jan. 14th when Daniel Ščerba of the Czech republic photographed sprites in the dead of winter:
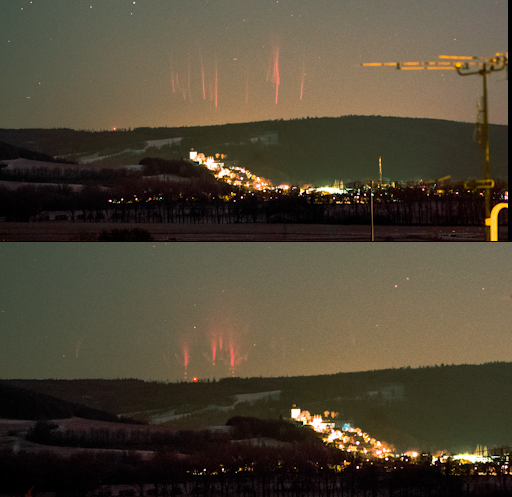
"These sprites were shooting up over a thunderstorm in the Adriatic Sea more than 700 km from my location," says Ščerba. In this map of weather radar data, the red arrow points from Ščerba's observatory to the storm. "In total, I photographed 16 sprites--my first of 2019."
What makes sprites appear in winter? Some researchers believe sprites are linked to cosmic rays: subatomic particles from deep space striking the top of Earth's atmosphere produce secondary electrons that, in turn, provide the spark that triggers sprites. Increasing levels of cosmic rays during Solar Minimum might explain why the red forms are spilling over into the "off-season." Diagram: How to Look for Sprites
Realtime Sprite Photo Gallery
Realtime Aurora Photo Gallery
Every night, a network of
NASA all-sky cameras scans the skies above the United States for meteoritic fireballs. Automated software maintained by NASA's Meteoroid Environment Office calculates their orbits, velocity, penetration depth in Earth's atmosphere and many other characteristics. Daily results are presented here on Spaceweather.com.
On Jan. 17, 2019, the network reported 14 fireballs.
(13 sporadics, 1 alpha Hydrid)
In this diagram of the inner solar system, all of the fireball orbits intersect at a single point--Earth. The orbits are color-coded by velocity, from slow (red) to fast (blue). [Larger image] [movies]
Potentially Hazardous Asteroids (
PHAs) are space rocks larger than approximately 100m that can come closer to Earth than 0.05 AU. None of the known PHAs is on a collision course with our planet, although astronomers are finding
new ones all the time.
On January 17, 2019 there were 1947 potentially hazardous asteroids.
 |
Recent & Upcoming Earth-asteroid encounters: | Asteroid | Date(UT) | Miss Distance | Velocity (km/s) | Diameter (m) |
| 2018 YU2 | 2019-Jan-12 | 5.6 LD | 4.6 | 19 |
| 2019 AE9 | 2019-Jan-12 | 0.3 LD | 19.2 | 13 |
| 2019 AX2 | 2019-Jan-12 | 17.6 LD | 22.1 | 43 |
| 2019 AK3 | 2019-Jan-12 | 4.9 LD | 10.7 | 14 |
| 2019 AC9 | 2019-Jan-12 | 4.1 LD | 10.1 | 26 |
| 2019 AK12 | 2019-Jan-13 | 2 LD | 15.3 | 11 |
| 2019 AR2 | 2019-Jan-13 | 7.6 LD | 4.8 | 49 |
| 2019 AG3 | 2019-Jan-14 | 12.9 LD | 14.6 | 85 |
| 2019 AS6 | 2019-Jan-14 | 12.2 LD | 7.2 | 20 |
| 2019 AU6 | 2019-Jan-14 | 2.6 LD | 8.9 | 17 |
| 2018 XN | 2019-Jan-14 | 11.9 LD | 5.6 | 59 |
| 2019 AT6 | 2019-Jan-15 | 8.1 LD | 5.1 | 10 |
| 2019 AM8 | 2019-Jan-15 | 8.6 LD | 10.9 | 15 |
| 2019 AG7 | 2019-Jan-15 | 3.9 LD | 6.8 | 30 |
| 2019 AU9 | 2019-Jan-16 | 7.7 LD | 5.1 | 16 |
| 2019 AM10 | 2019-Jan-16 | 17.5 LD | 3.6 | 36 |
| 2019 AR8 | 2019-Jan-16 | 9.7 LD | 8.9 | 27 |
| 2019 AC3 | 2019-Jan-17 | 10.7 LD | 4.4 | 12 |
| 2019 AB5 | 2019-Jan-19 | 7.5 LD | 6.6 | 28 |
| 2019 AZ8 | 2019-Jan-20 | 13.7 LD | 10 | 25 |
| 2019 AO8 | 2019-Jan-20 | 10.4 LD | 11.3 | 26 |
| 2019 AX8 | 2019-Jan-22 | 18.1 LD | 16.2 | 38 |
| 2019 AS11 | 2019-Jan-23 | 7 LD | 4.3 | 16 |
| 2019 AN12 | 2019-Jan-25 | 9.2 LD | 20.3 | 29 |
| 2019 AG11 | 2019-Jan-25 | 8.7 LD | 7.5 | 20 |
| 2019 AA10 | 2019-Jan-26 | 5.6 LD | 9.8 | 28 |
| 2019 AP11 | 2019-Jan-28 | 10.3 LD | 7.8 | 31 |
| 2019 AN11 | 2019-Jan-29 | 12.7 LD | 8.1 | 31 |
| 2013 CW32 | 2019-Jan-29 | 13.9 LD | 16.4 | 148 |
| 2019 AV2 | 2019-Feb-01 | 17.6 LD | 13 | 204 |
| 2013 RV9 | 2019-Feb-06 | 17.9 LD | 5.9 | 68 |
| 2017 PV25 | 2019-Feb-12 | 7.3 LD | 6.1 | 43 |
| 455176 | 2019-Feb-20 | 19.2 LD | 26.5 | 269 |
| 2016 CO246 | 2019-Feb-22 | 15.8 LD | 5.5 | 23 |
| 2018 DE1 | 2019-Feb-27 | 19.8 LD | 6.5 | 28 |
| 2016 FU12 | 2019-Feb-27 | 15.4 LD | 5.2 | 15 |
| 2015 EG | 2019-Mar-04 | 1.2 LD | 9.6 | 26 |
| 2013 EG68 | 2019-Mar-13 | 19.3 LD | 17 | 37 |
| 2012 VZ19 | 2019-Mar-13 | 7.7 LD | 8 | 27 |
Notes: LD means "Lunar Distance." 1 LD = 384,401 km, the distance between Earth and the Moon. 1 LD also equals 0.00256 AU. MAG is the visual magnitude of the asteroid on the date of closest approach. | | Cosmic Rays in the Atmosphere |
SOMETHING NEW! We have developed a new predictive model of aviation radiation. It's called E-RAD--short for Empirical RADiation model. We are constantly flying radiation sensors onboard airplanes over the US and and around the world, so far collecting more than 22,000 gps-tagged radiation measurements. Using this unique dataset, we can predict the dosage on any flight over the USA with an error no worse than 15%.
E-RAD lets us do something new: Every day we monitor approximately 1400 flights criss-crossing the 10 busiest routes in the continental USA. Typically, this includes more than 80,000 passengers per day. E-RAD calculates the radiation exposure for every single flight.
The Hot Flights Table is a daily summary of these calculations. It shows the 5 charter flights with the highest dose rates; the 5 commercial flights with the highest dose rates; 5 commercial flights with near-average dose rates; and the 5 commercial flights with the lowest dose rates. Passengers typically experience dose rates that are 20 to 70 times higher than natural radiation at sea level.
To measure radiation on airplanes, we use the same sensors we fly to the stratosphere onboard Earth to Sky Calculus cosmic ray balloons: neutron bubble chambers and X-ray/gamma-ray Geiger tubes sensitive to energies between 10 keV and 20 MeV. These energies span the range of medical X-ray machines and airport security scanners.
Column definitions: (1) The flight number; (2) The maximum dose rate during the flight, expressed in units of natural radiation at sea level; (3) The maximum altitude of the plane in feet above sea level; (4) Departure city; (5) Arrival city; (6) Duration of the flight.
SPACE WEATHER BALLOON DATA: Approximately once a week, Spaceweather.com and the students of Earth to Sky Calculus fly space weather balloons to the stratosphere over California. These balloons are equipped with radiation sensors that detect cosmic rays, a surprisingly "down to Earth" form of space weather. Cosmic rays can seed clouds, trigger lightning, and penetrate commercial airplanes. Furthermore, there are studies ( #1, #2, #3, #4) linking cosmic rays with cardiac arrhythmias and sudden cardiac death in the general population. Our latest measurements show that cosmic rays are intensifying, with an increase of more than 18% since 2015:
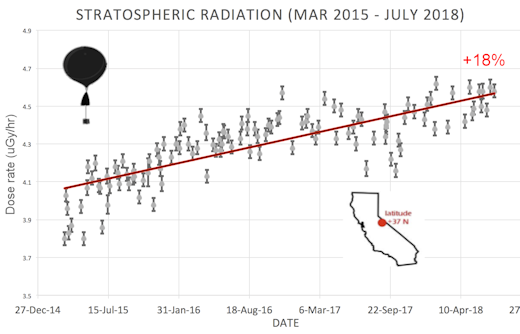
The data points in the graph above correspond to the peak of the Reneger-Pfotzer maximum, which lies about 67,000 feet above central California. When cosmic rays crash into Earth's atmosphere, they produce a spray of secondary particles that is most intense at the entrance to the stratosphere. Physicists Eric Reneger and Georg Pfotzer discovered the maximum using balloons in the 1930s and it is what we are measuring today.
En route to the stratosphere, our sensors also pass through aviation altitudes:
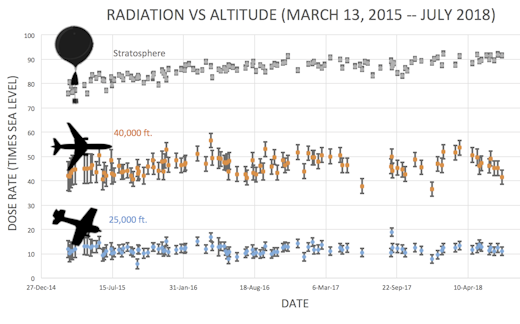
In this plot, dose rates are expessed as multiples of sea level. For instance, we see that boarding a plane that flies at 25,000 feet exposes passengers to dose rates ~10x higher than sea level. At 40,000 feet, the multiplier is closer to 50x.
The radiation sensors onboard our helium balloons detect X-rays and gamma-rays in the energy range 10 keV to 20 MeV. These energies span the range of medical X-ray machines and airport security scanners.
Why are cosmic rays intensifying? The main reason is the sun. Solar storm clouds such as coronal mass ejections (CMEs) sweep aside cosmic rays when they pass by Earth. During Solar Maximum, CMEs are abundant and cosmic rays are held at bay. Now, however, the solar cycle is swinging toward Solar Minimum, allowing cosmic rays to return. Another reason could be the weakening of Earth's magnetic field, which helps protect us from deep-space radiation.
| | The official U.S. government space weather bureau |
| | The first place to look for information about sundogs, pillars, rainbows and related phenomena. |
| | Researchers call it a "Hubble for the sun." SDO is the most advanced solar observatory ever. |
| | 3D views of the sun from NASA's Solar and Terrestrial Relations Observatory |
| | Realtime and archival images of the Sun from SOHO. |
| | from the NOAA Space Environment Center |
| | fun to read, but should be taken with a grain of salt! Forecasts looking ahead more than a few days are often wrong. |
| | from the NOAA Space Environment Center |
| | the underlying science of space weather |
 | If you are a Youtuber and want to buy real Youtube views than try out Buyrealsocial.com for the best results possible! |
| To find reviews of new online casino sites in the UK try The Casino DB where there are hundreds of online casino reviews complete with bonuses and ratings. Looking for a new online casino? Try Casimpo the new site dedicated to making online casino simple and easy for all. |
| | These links help Spaceweather.com stay online. Thank you to our supporters! |
| | | | | | |


