You are viewing the page for Oct. 4, 2019
  Select another date:
<<back forward>>
SpaceWeather.com -- News and information about meteor showers, solar flares, auroras, and near-Earth asteroids
 
Solar wind
speed: 409.0 km/sec
density: 3.2 protons/cm3
more data: ACE, DSCOVR
Updated: Today at 2346 UT
X-ray Solar Flares
6-hr max: A7
1926 UT Oct04
24-hr: A8
0104 UT Oct04
explanation | more data
Updated: Today at: 2300 UT
Daily Sun: 04 Oct 19
The sun is blank--no sunspots. Credit: SDO/HMI
Sunspot number: 0
What is the sunspot number?
Updated 04 Oct 2019

Spotless Days
Current Stretch: 1 day
2019 total: 200 days (72%)
2018 total: 221 days (61%)
2017 total: 104 days (28%)
2016 total: 32 days (9%)
2015 total: 0 days (0%)
2014 total: 1 day (<1%)
2013 total: 0 days (0%)
2012 total: 0 days (0%)
2011 total: 2 days (<1%)
2010 total: 51 days (14%)
2009 total: 260 days (71%)
2008 total: 268 days (73%)
2007 total: 152 days (42%)
2006 total: 70 days (19%)

Updated 04 Oct 2019


Thermosphere Climate Index
today: 4.79
x1010 W Cold
Max: 49.4
x1010 W Hot (10/1957)
Min: 2.05
x1010 W Cold (02/2009)
explanation | more data: gfx, txt
Updated 03 Oct 2019

The Radio Sun
10.7 cm flux: 68 sfu
explanation | more data
Updated 04 Oct 2019

Cosmic Rays Solar minimum is underway. The sun's magnetic field is weak, allowing extra cosmic rays into the solar system. Neutron counts from the University of Oulu's Sodankyla Geophysical Observatory show that cosmic rays reaching Earth in 2019 are near a Space Age peak.


Oulu Neutron Counts

Percentages of the Space Age average:
today: +9.6% High
30-day change: +0.7%
Max: +11.7% Very High
(12/2009)
Min: -32.1% Very Low (06/1991)
explanation | more data
Updated 04 Oct 2019 @ 1200 UT

Current Auroral Oval:
Switch to: Europe, USA, New Zealand, Antarctica
Credit: NOAA/Ovation
Planetary K-index
Now: Kp= 2 quiet
24-hr max: Kp= 3
quiet
explanation | more data
Interplanetary Mag. Field
Btotal: 2.0 nT
Bz: -1.2 nT south
more data: ACE, DSCOVR
Updated: Today at 2345 UT
Coronal Holes: 04 Oct 19

Minor streams of solar wind flowing from these southern coronal holes could graze Earth between Oct. 4th and 6th.
Credit: SDO/AIA

Noctilucent Clouds The northern season for noctilucent clouds has ended. NASA's AIM spacecraft is no longer detecting electric-blue clouds around the Arctic Circle.
Switch view: Europe, USA, Asia, Polar
Updated at: 09-03-2019 13:55:02 UT
SPACE WEATHER
NOAA Forecasts
Updated at: 2019 Oct 04 2200 UTC
FLARE
0-24 hr
24-48 hr
CLASS M
01 %
01 %
CLASS X
01 %
01 %
Geomagnetic Storms:
Probabilities for significant disturbances in Earth's magnetic field are given for three activity levels: active, minor storm, severe storm
Updated at: 2019 Oct 04 2200 UTC
Mid-latitudes
0-24 hr
24-48 hr
ACTIVE
15 %
10 %
MINOR
05 %
01 %
SEVERE
01 %
01 %
High latitudes
0-24 hr
24-48 hr
ACTIVE
15 %
15 %
MINOR
25 %
20 %
SEVERE
25 %
15 %
 
Friday, Oct. 4, 2019
What's up in space


Special Offer: SAVE 600nok per person. Book a combination aurora borealis chase and scenic day tour during the months of September, October or November 2019 for the special price of 1800 kr. Check Marianne's webpage for details!


NEW COSMIC RAY DATA FEED ON SPACEWEATHER.COM: As Solar Minimum deepens, cosmic rays are intensifying. You can now watch the daily change in radiation right here on Spaceweather.com. A new data feed displays neutron monitor measurements from the University of Oulu's Cosmic Ray Station in Finland. Radiation levels are now just percentage points away from setting a Space Age record: full story.

IRISH SKIES TURN PURPLE: Decaying hurricane Lambert swept past Ireland yesterday. Curiously, when the skies cleared they weren't blue. "They were purple," reports John Murphy, who sends this picture from Cork City:

"As Oct. 3rd came to an end, strong gusts and heavy rain eventually gave way to this volcanic sunset," he says.

That's right. Hurricane Lambert didn't cause the strangely colored sunset. The Raikoke volcano did. Located in Russia's Kuril islands, Raikoke erupted on June 22nd, pushing volcanic aerosols high into the stratosphere. They're still up there. Apparently, one of the sulfurous plumes followed Hurricane Lambert across Ireland Oct 3rd, painting the sunset sky with unusual color.

Why purple? Fine volcanic aerosols in the stratosphere scatter blue light which, when mixed with ordinary sunset red, produces a purple hue. Months after Raikoke erupted, sky watchers around the world are still seeing purple skies when its emissions float by. Browse the gallery for more examples.

Realtime Volcanic Sunset Photo Gallery
Free: Spaceweather.com Newsletter

A MULTIPLE ANALEMMA: If you took a picture of the sun at the same time each day, would it remain in the same position? The answer is no, and the figure-8 shape traced out by the sun over the course of a year is called an analemma. Over the years, Spaceweather.com has featured many beautiful analemmas ... but none like this. John Dartnell of North Wiltshire, UK, photographed the sun 24 times a day for a whole year, creating a rare multiple "biscuit tin" analemma:


"I made a pinhole camera from a biscuit tin," explains Dartnell. "Exposures were controlled by a battery driven clock. A rotating disc with a cut out slot acted as a shutter to give an exposure every hour. The resulting image shows six analemmas with traces of three others."

In all, this one picture captures 12 months of exposure time on a single photographic paper--from Sept. 2018 to Sept.  2019. The upper and lower tips of each "8" represent the solstices--the longest and shortest days of the year. Equinoxes occur near the necks.

"Making an analemma in the UK is a challenge because of our cloudy weather," says Dartnell. "You can't consistently see the sun at noon.  That why I decided on this approach of setting up a pinhole camera that could record the sun at intervals throughout the day. As you can imagine, at the end of the year I opened up the tin with a mixture of great anticipation and potential disappointment. I was glad to see it was a success."

Realtime Analemma Photo Gallery
Free: Spaceweather.com Newsletter

THE ANTARES PENDANT: Are you looking for a far-out gift? Consider the Antares Pendant. On Aug. 19, 2019, the students of Earth to Sky Calculus launched a cosmic ray balloon to the edge of space, 104,002 ft high. This ruby-red crystal necklace went along for the ride:

You can have it for $179.95. The students are selling these white gold-plated pendants to support their cosmic ray ballooning program. The glittering Swarovski crystal has a deep ruby hue inspired by the red-supergiant star Antares in Scorpio. Each one comes with greeting card showing the pendant in flight and telling the story of its journey to the edge of space and back again.

Far Out Gifts: Earth to Sky Store
All sales support hands-on STEM education


Realtime Space Weather Photo Gallery
Free: Spaceweather.com Newsletter


Realtime Aurora Photo Gallery
Free:
Spaceweather.com Newsletter

  All Sky Fireball Network
Every night, a network of NASA all-sky cameras scans the skies above the United States for meteoritic fireballs. Automated software maintained by NASA's Meteoroid Environment Office calculates their orbits, velocity, penetration depth in Earth's atmosphere and many other characteristics. Daily results are presented here on Spaceweather.com.

On Oct. 3, 2019, the network reported 22 fireballs.
(21 sporadics, 1 southern Taurid)

In this diagram of the inner solar system, all of the fireball orbits intersect at a single point--Earth. The orbits are color-coded by velocity, from slow (red) to fast (blue). [Larger image] [movies]

  Near Earth Asteroids
Potentially Hazardous Asteroids (PHAs) are space rocks larger than approximately 100m that can come closer to Earth than 0.05 AU. None of the known PHAs is on a collision course with our planet, although astronomers are finding new ones all the time.
On October 4, 2019 there were 2018 potentially hazardous asteroids.
Recent & Upcoming Earth-asteroid encounters:
Asteroid
Date(UT)
Miss Distance
Velocity (km/s)
Diameter (m)
2019 TA
2019-Sep-29
1.2 LD
6.2
5
2019 SE5
2019-Sep-29
5.7 LD
6.6
15
2019 SO1
2019-Sep-29
11.3 LD
7.5
16
2019 SA5
2019-Sep-29
19.2 LD
7.8
25
2019 TD
2019-Sep-29
0.3 LD
10.1
5
2019 TF
2019-Sep-29
18 LD
10
11
2019 SN4
2019-Sep-29
6.5 LD
19.6
48
2019 TC
2019-Sep-29
14.5 LD
12.3
19
2019 SH3
2019-Sep-30
3.1 LD
14.2
27
2019 SN3
2019-Sep-30
2.2 LD
7.7
16
2019 SP
2019-Sep-30
6.6 LD
15.1
46
2019 TR
2019-Oct-01
15.7 LD
8.1
28
2019 SJ9
2019-Oct-01
7.8 LD
8.4
14
2019 SM8
2019-Oct-01
0.4 LD
14.2
5
2019 SE8
2019-Oct-01
2.8 LD
22.8
15
2019 SE9
2019-Oct-01
14.1 LD
4.1
37
2018 FK5
2019-Oct-01
13.3 LD
10.5
8
2019 SD8
2019-Oct-02
1.4 LD
10.9
12
2019 SX3
2019-Oct-02
8.7 LD
8.7
30
2019 SA6
2019-Oct-02
11.8 LD
16.6
30
2019 TW
2019-Oct-02
4.5 LD
3.7
10
2018 LG4
2019-Oct-02
13.8 LD
8.1
12
2019 SL8
2019-Oct-03
7.9 LD
13.3
24
2019 SP3
2019-Oct-03
1 LD
8.7
20
2019 SH9
2019-Oct-03
4.6 LD
14.9
10
2019 TK
2019-Oct-03
1.2 LD
13.9
9
2019 TX
2019-Oct-04
1.3 LD
7.3
7
2019 TV
2019-Oct-05
4.1 LD
9.1
9
2017 TJ4
2019-Oct-05
13.5 LD
8.9
32
2019 SZ4
2019-Oct-06
18.7 LD
6.5
25
2019 TH
2019-Oct-06
14.7 LD
11.5
26
2019 TU
2019-Oct-08
4.4 LD
9.8
21
2019 RK
2019-Oct-08
16.7 LD
3
30
2019 TC1
2019-Oct-08
3.5 LD
13.1
12
2019 SB6
2019-Oct-08
7.8 LD
7.8
16
2019 TM
2019-Oct-08
9.4 LD
12.9
38
2019 TS
2019-Oct-08
8.4 LD
7.8
29
2019 TZ
2019-Oct-09
8 LD
11.6
16
2019 SL7
2019-Oct-09
1.4 LD
17.1
22
2019 SX5
2019-Oct-10
17.7 LD
21.8
82
2019 SK8
2019-Oct-12
10.5 LD
8.4
21
2019 SV9
2019-Oct-12
8.6 LD
13.6
30
2019 SE2
2019-Oct-12
19.2 LD
10.2
54
2019 SR8
2019-Oct-16
13.5 LD
9.8
26
2019 TA1
2019-Oct-18
15.2 LD
6.5
22
2019 SJ8
2019-Oct-19
11.6 LD
7.4
47
162082
2019-Oct-25
16.2 LD
11.2
589
2017 TG5
2019-Oct-25
14.4 LD
11.9
34
2015 JD1
2019-Nov-03
12.9 LD
11.9
269
2010 JG
2019-Nov-12
19.6 LD
14.9
235
481394
2019-Nov-21
11.3 LD
7.9
372
2008 EA9
2019-Nov-23
10.5 LD
2.2
10
Notes: LD means "Lunar Distance." 1 LD = 384,401 km, the distance between Earth and the Moon. 1 LD also equals 0.00256 AU. MAG is the visual magnitude of the asteroid on the date of closest approach.
  Cosmic Rays in the Atmosphere

SOMETHING NEW! We have developed a new predictive model of aviation radiation. It's called E-RAD--short for Empirical RADiation model. We are constantly flying radiation sensors onboard airplanes over the US and and around the world, so far collecting more than 22,000 gps-tagged radiation measurements. Using this unique dataset, we can predict the dosage on any flight over the USA with an error no worse than 15%.

E-RAD lets us do something new: Every day we monitor approximately 1400 flights criss-crossing the 10 busiest routes in the continental USA. Typically, this includes more than 80,000 passengers per day. E-RAD calculates the radiation exposure for every single flight.

The Hot Flights Table is a daily summary of these calculations. It shows the 5 charter flights with the highest dose rates; the 5 commercial flights with the highest dose rates; 5 commercial flights with near-average dose rates; and the 5 commercial flights with the lowest dose rates. Passengers typically experience dose rates that are 20 to 70 times higher than natural radiation at sea level.

To measure radiation on airplanes, we use the same sensors we fly to the stratosphere onboard Earth to Sky Calculus cosmic ray balloons: neutron bubble chambers and X-ray/gamma-ray Geiger tubes sensitive to energies between 10 keV and 20 MeV. These energies span the range of medical X-ray machines and airport security scanners.

Column definitions: (1) The flight number; (2) The maximum dose rate during the flight, expressed in units of natural radiation at sea level; (3) The maximum altitude of the plane in feet above sea level; (4) Departure city; (5) Arrival city; (6) Duration of the flight.

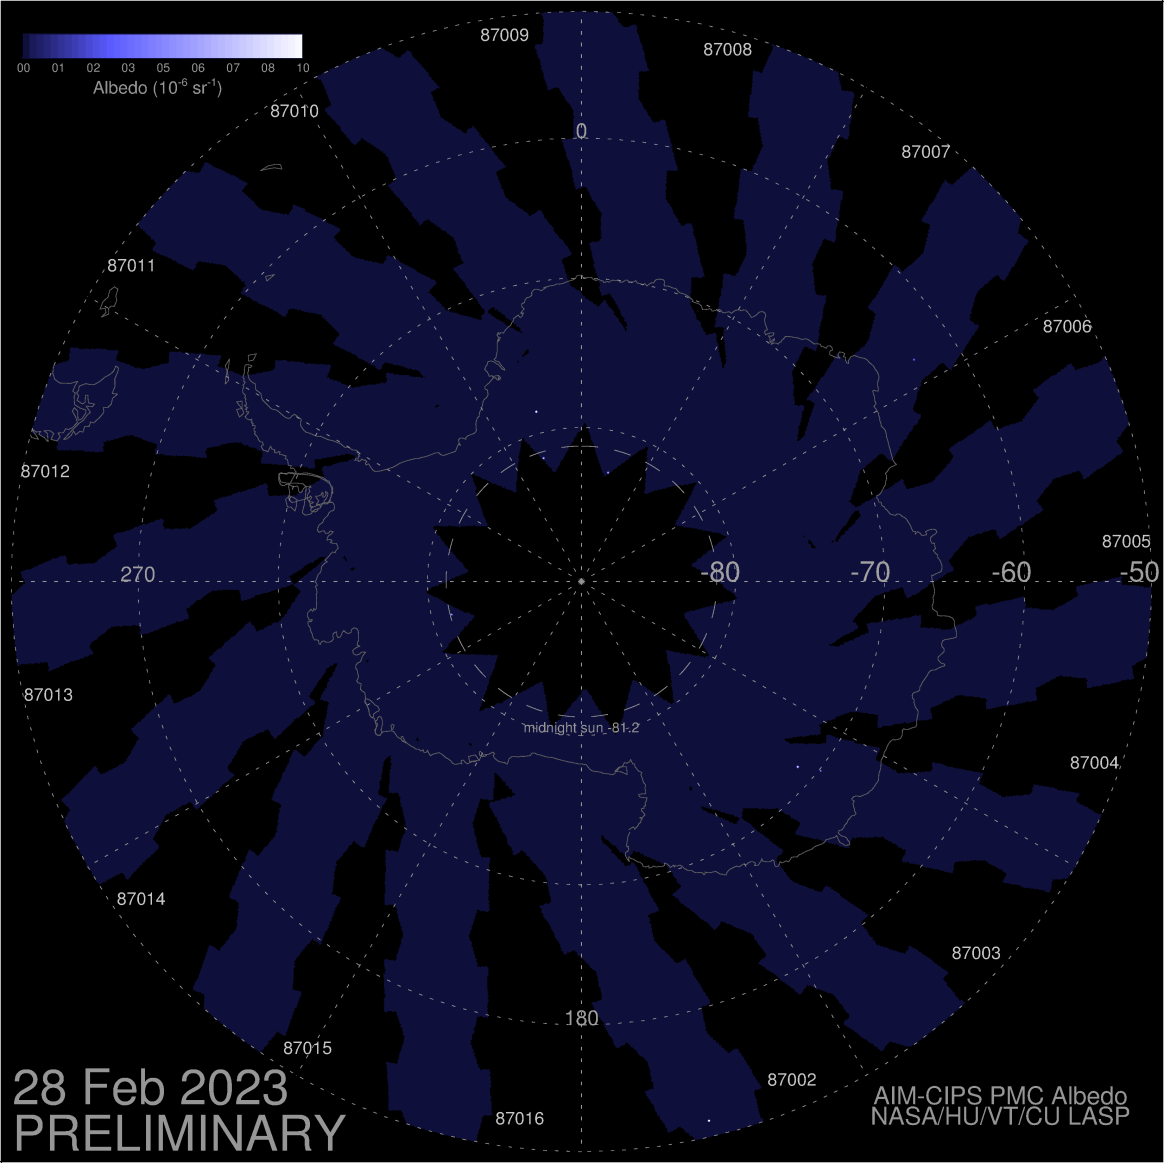
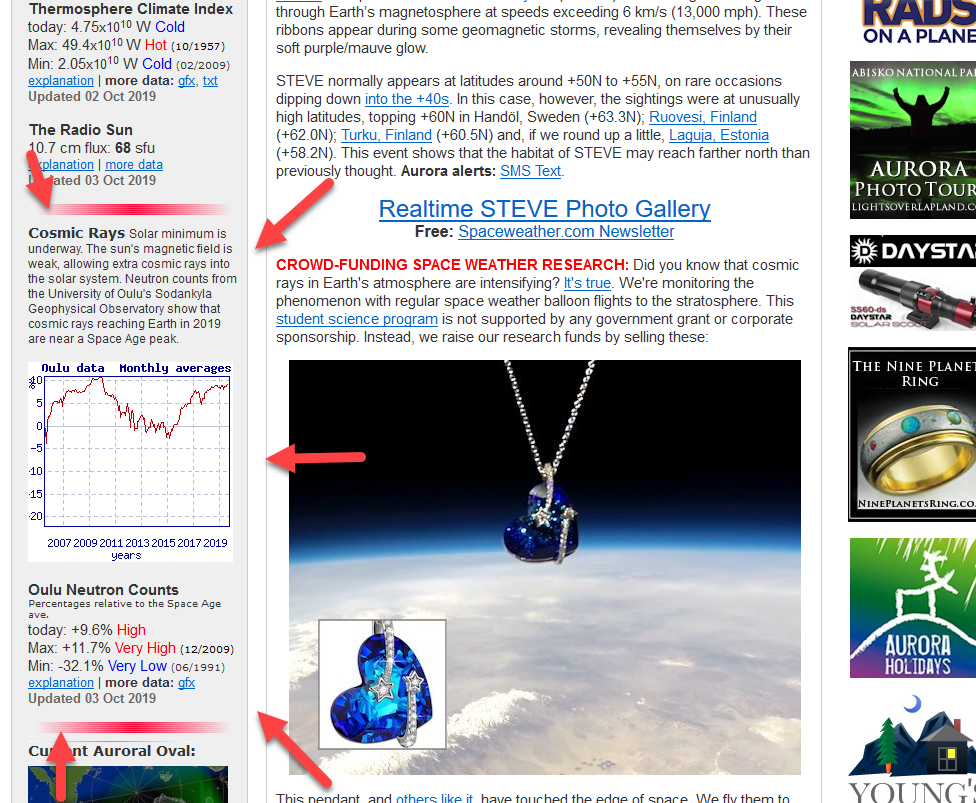
SPACE WEATHER BALLOON DATA: Approximately once a week, Spaceweather.com and the students of Earth to Sky Calculus fly space weather balloons to the stratosphere over California. These balloons are equipped with radiation sensors that detect cosmic rays, a surprisingly "down to Earth" form of space weather. Cosmic rays can seed clouds, trigger lightning, and penetrate commercial airplanes. Furthermore, there are studies ( #1, #2, #3, #4) linking cosmic rays with cardiac arrhythmias and sudden cardiac death in the general population. Our latest measurements show that cosmic rays are intensifying, with an increase of more than 18% since 2015:

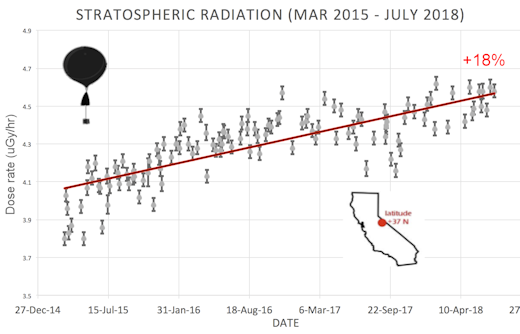
The data points in the graph above correspond to the peak of the Reneger-Pfotzer maximum, which lies about 67,000 feet above central California. When cosmic rays crash into Earth's atmosphere, they produce a spray of secondary particles that is most intense at the entrance to the stratosphere. Physicists Eric Reneger and Georg Pfotzer discovered the maximum using balloons in the 1930s and it is what we are measuring today.

En route to the stratosphere, our sensors also pass through aviation altitudes:

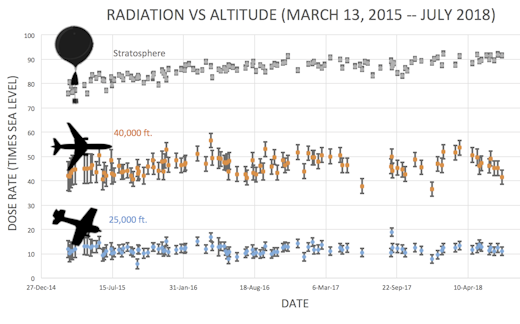
In this plot, dose rates are expessed as multiples of sea level. For instance, we see that boarding a plane that flies at 25,000 feet exposes passengers to dose rates ~10x higher than sea level. At 40,000 feet, the multiplier is closer to 50x.

The radiation sensors onboard our helium balloons detect X-rays and gamma-rays in the energy range 10 keV to 20 MeV. These energies span the range of medical X-ray machines and airport security scanners.

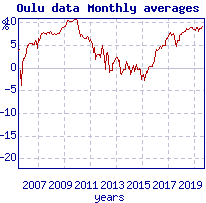
Why are cosmic rays intensifying? The main reason is the sun. Solar storm clouds such as coronal mass ejections (CMEs) sweep aside cosmic rays when they pass by Earth. During Solar Maximum, CMEs are abundant and cosmic rays are held at bay. Now, however, the solar cycle is swinging toward Solar Minimum, allowing cosmic rays to return. Another reason could be the weakening of Earth's magnetic field, which helps protect us from deep-space radiation.

  Essential web links
NOAA Space Weather Prediction Center
  The official U.S. government space weather bureau
Atmospheric Optics
  The first place to look for information about sundogs, pillars, rainbows and related phenomena.
Solar Dynamics Observatory
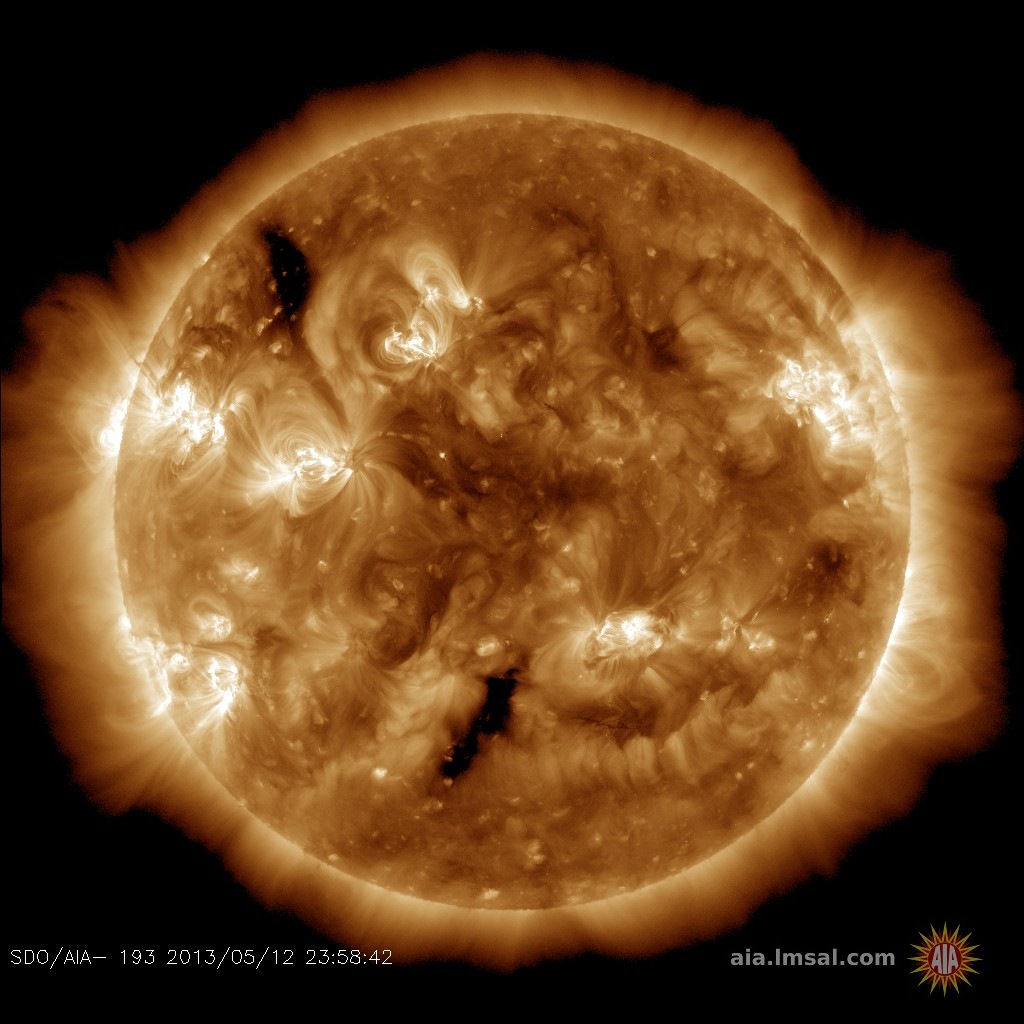
  Researchers call it a "Hubble for the sun." SDO is the most advanced solar observatory ever.
STEREO
  3D views of the sun from NASA's Solar and Terrestrial Relations Observatory
Solar and Heliospheric Observatory
  Realtime and archival images of the Sun from SOHO.
Daily Sunspot Summaries
  from the NOAA Space Environment Center
NOAA 27-Day Space Weather Forecasts
  fun to read, but should be taken with a grain of salt! Forecasts looking ahead more than a few days are often wrong.
Aurora 30 min forecast
  from the NOAA Space Environment Center
Heliophysics
  the underlying science of space weather

Spaceweather.com welcomes these supporters of science communication: RV Sales and CRAS, the Conservatory of Recording Arts and Sciences and Windshield Replacement Phoenix and Breast Augmentation Phoenix and Dentist Chandler, AZ.

   
Look no further to find the best Comox Valley Real Estate listings and homes for sale
   
NASA Near Earth Asteroid Home Page
   
Chicago SEO Expert
   
Search Kelowna Real Estate Listings & Homes for Sale easily.
Find help on all Calgary Homes For Sale and Real Estate Listings. Great source for Edmonton Real Estate Listings & Homes For Sale
The best place for soundcloud followers buy is definitely BRSM.IO

To find reviews of new online casino sites in the UK try The Casino DB where there are hundreds of online casino reviews complete with bonuses and ratings.

Looking for a new online casino? Try Casimpo the new site dedicated to making online casino simple and easy for all.

  These links help Spaceweather.com stay online. Thank you to our supporters!
  more links...
       
©2019 Spaceweather.com. All rights reserved. This site is penned daily by Dr. Tony Phillips.
©2019 Spaceweather.com. All rights reserved.