Lights Over Lapland has a brand-new website full of exciting adventures in Abisko National Park, Sweden! Take a look at our aurora activities and book your once-in-a-lifetime trip with us today! | | |
RADS ON A PLANE--NEW RESULTS: Many people think that only astronauts need to worry about cosmic radiation. Not so. Ordinary air travelers are exposed to cosmic rays, too. A recent study from researchers at Harvard found that flight attendants have a higher risk of cancer than members of the general population, and the International Commission on Radiological Protection has classified pilots as occupational radiation workers.
How much radiation do you absorb? Spaceweather.com and the students of Earth to Sky Calculus have been working to answer this question by taking cosmic ray detectors onboard commercial airplanes. Flying since 2015, we have collected more than 22,000 GPS-tagged radiation measurements over 27 countries, 5 continents, and 2 oceans.
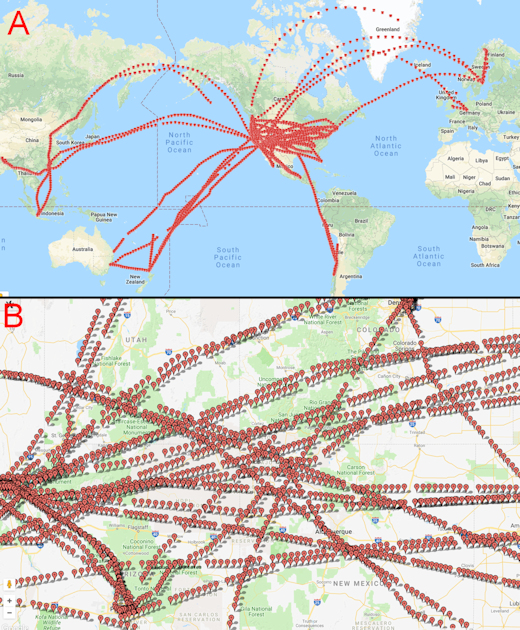
(A) A global overview of our flights. (B) To show the typical density of our data, we zoom in to the Four Corners region of the USA.
Here is what we have learned so far:
- Radiation always increases with altitude, with dose rates doubling every 5000 to 6000 feet. This make sense: The closer you get to space, the more cosmic rays you absorb.
- At typical cruising altitudes, cosmic radiation is 40 to 60 times greater than natural sources at sea level.
- Passengers on cross-country flights across the USA typically absorb a whole body dose equal to 1 or 2 dental X-rays.
- On international flights, the total dose can increase ~five-fold with passengers racking up 5 to 6 dental X-rays.
Using our database, we can investigate patterns of radiation around the world. For instance, this plot compares aviation radiation over the tropics vs. the Arctic:
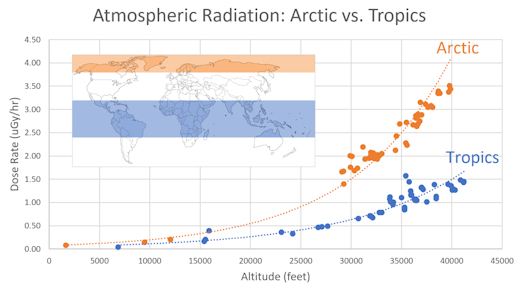
We see that the Arctic is a high radiation zone. This comes as no surprise. Researchers have long known that particles from space easily penetrate Earth's magnetic field near the poles, while the equator offers greater resistance. That's why auroras are in Sweden instead of Mexico. Generally speaking, passengers flying international routes over the poles absorb 2 to 3 times more radiation than passengers at lower latitudes.
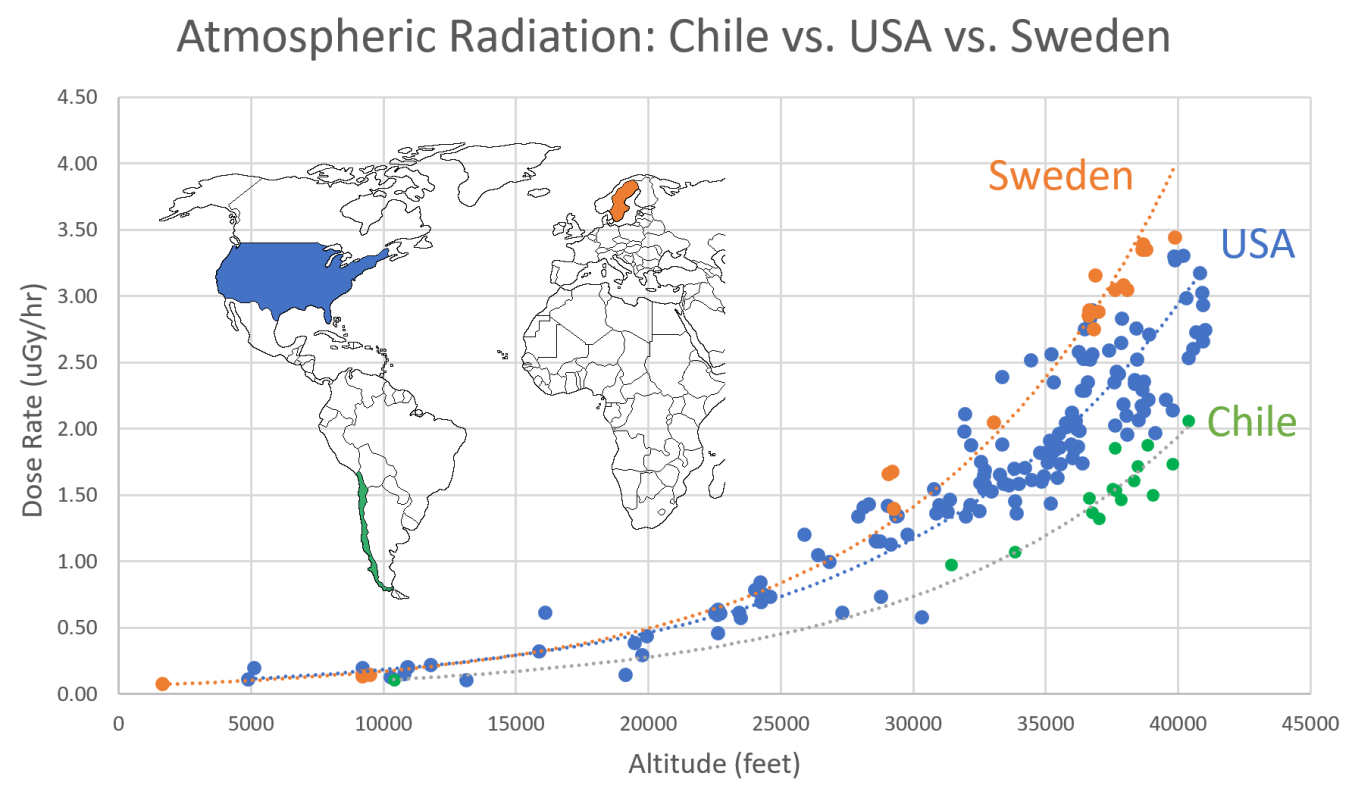
We can also look at individual countries--e.g., Sweden vs. the USA vs. Chile:
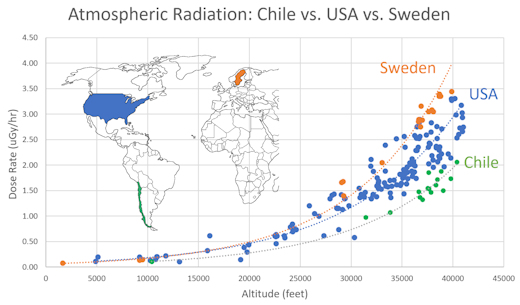
As an Arctic country, Sweden has the most radiation–no surprise. The continental USA straddles the middle–again, no surprise. A mid-latitude country can be expected to have middling radiation. Chile, however, is more of a puzzle.
Although Chile does not cross the equator, it has some of the lowest readings in our database. This phenomenon is almost certainly linked to Chile's location on the verge of the South Atlantic Anomaly–a distortion in Earth's magnetic field that affects radiation levels. We are actively investigating the situation in Chile with additional flights, and will report results in a future blog.
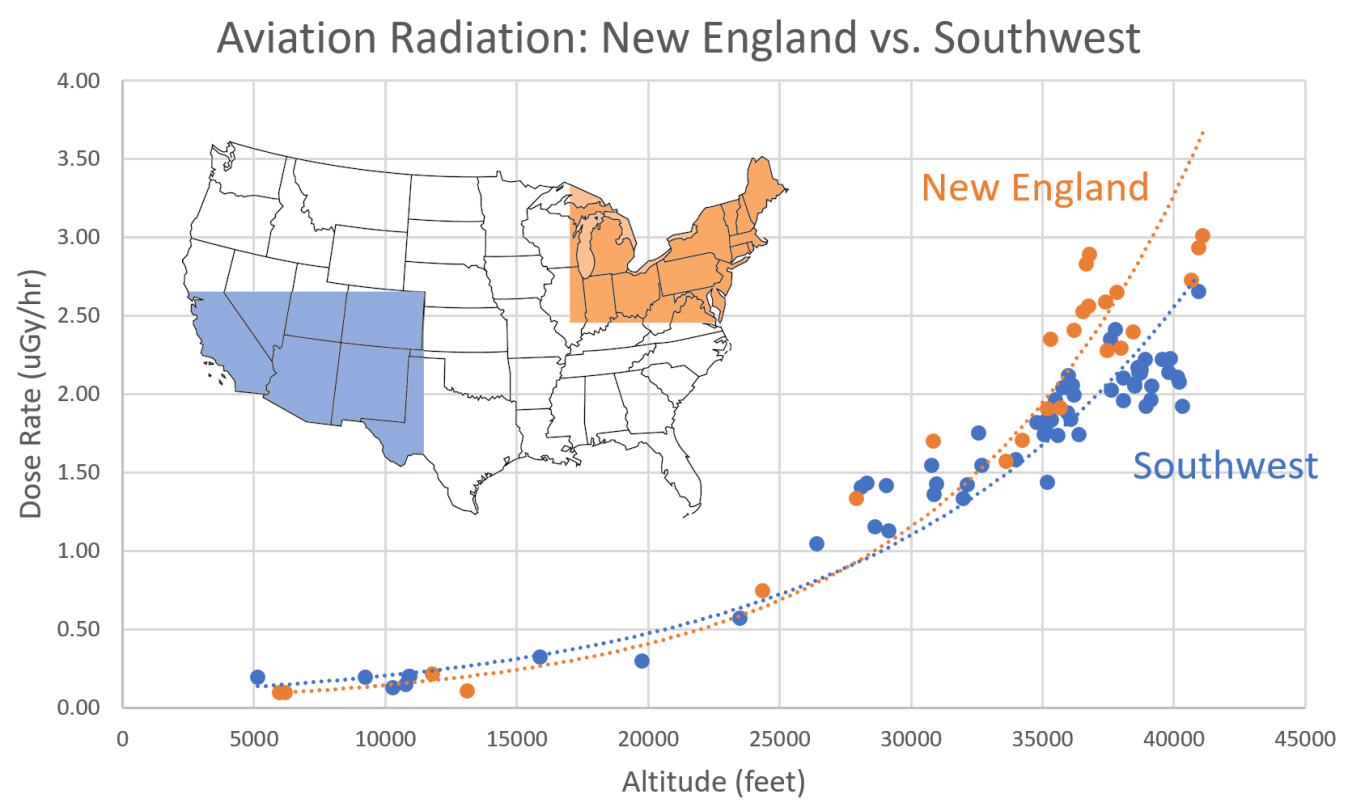
Because our home base is in the USA, we spend a lot of time flying there. The US dataset is so dense, we can investigate regional differences across the country--for example, New England vs. the Southwest:

The two curves are indistinguishable below ~30,000 feet, but at higher altitudes they diverge. By the time a plane reaches 40,000 feet, it would experience 30% more radiation over New England than the same plane flying above the desert Southwest. According to our measurements so far, New England is the "hottest" region of the continental USA, radiation-wise, with the Pacific Northwest a close second.
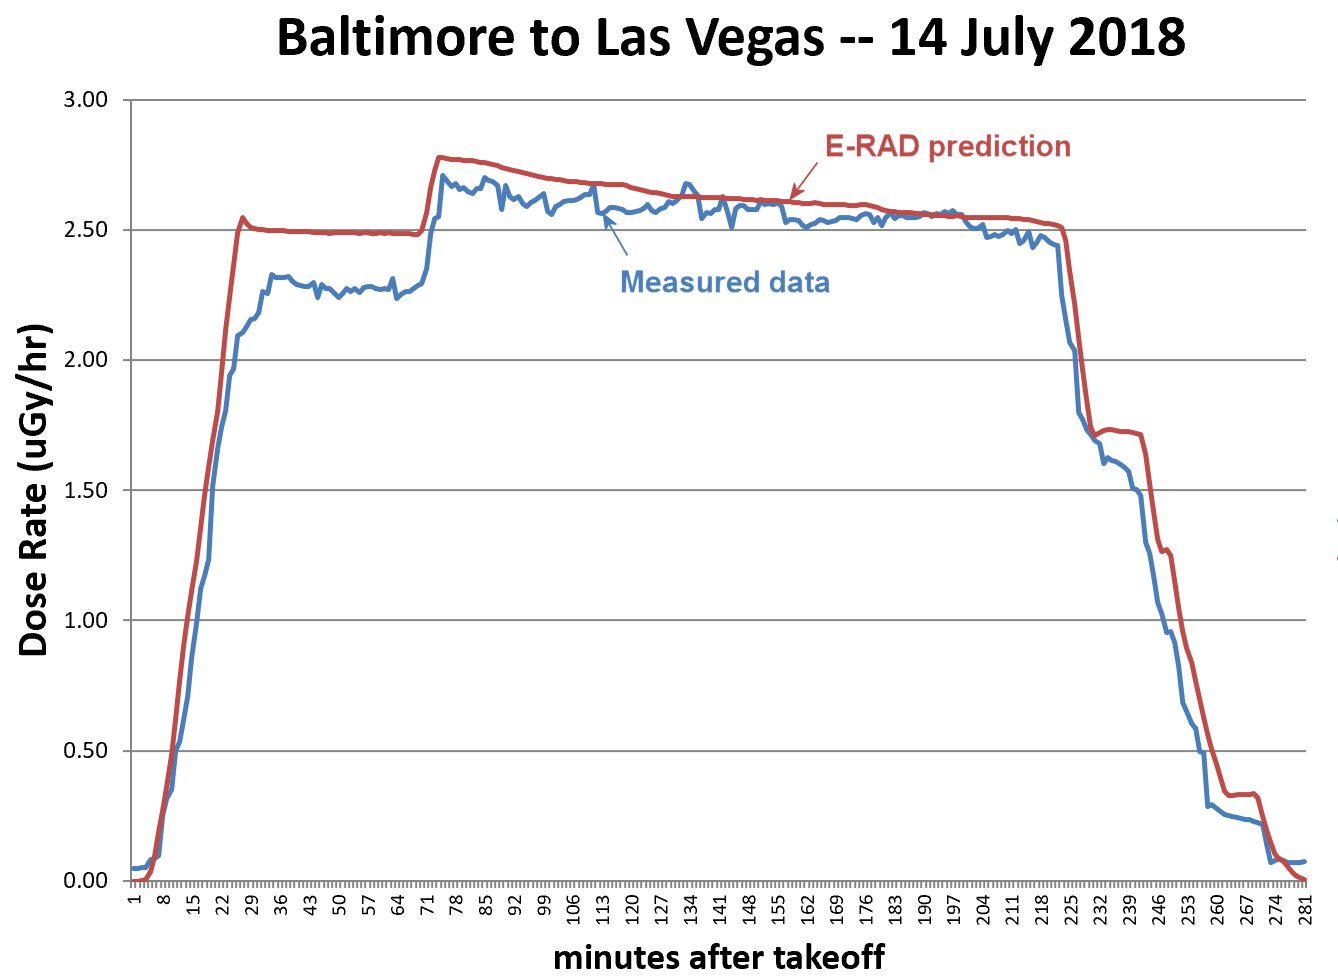
Perhaps the most important outcome of our work so far is E-RAD–a new predictive model of aviation radiation. We can now predict dose rates on flights in areas where we have flown before. Because it is constantly updated with new data, E-RAD naturally keeps up with variables that affect cosmic rays such as the solar cycle and changes in Earth's magnetic field.
Here is an example of a recent flight we took from Baltimore to Las Vegas, comparing E-RAD's predictions with actual measurements:
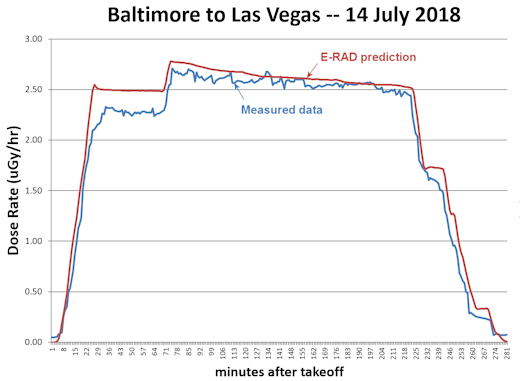
The two agree within 10% for most of the flight. These errors are shrinking as we add new readings to our database.
The results in this report are offered as a preview of what we are learning. Our database is growing almost-daily with new flights to new places, and we will have more results to share in the weeks ahead. We've created a website to showcase what we are learning and ultimately to let you, the reader, interact with our databases as well: RadsonaPlane.com.
Visit RadsonaPlane.com for Updates
WHERE NO CRYSTAL SPACESHIP HAS GONE BEFORE: On Sept. 24, 2018, the students of Earth to Sky Calculus launched the starship Enterprise to the stratosphere. Riding onboard a high-altitude cosmic ray balloon, the laser-etched crystal spaceship traveled 34.7 km (113,845 feet) above Earth's surface:
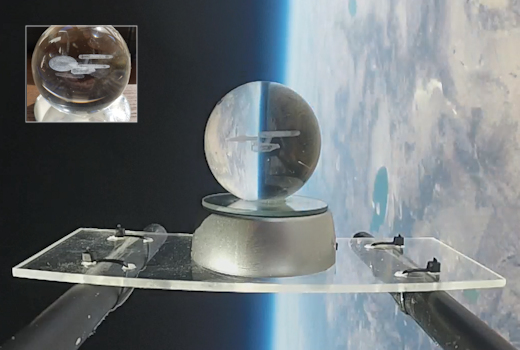
You can have it for $149.95. The students are selling the Enterprise to support their cosmic ray ballooning program. Each starship comes with a greeting card showing the item in flight and telling the story of its journey to the edge of space. Also included is a multi-colored LED illuminated stand (shown in the picture above). This creates a colorful visual effect and allows the Enterprise to be used as a far-out night light.
Far Out Gifts: Earth to Sky Store
All sales support hands-on STEM education
Realtime Aurora Photo Gallery
Realtime Space Weather Photo Gallery
Every night, a network of
NASA all-sky cameras scans the skies above the United States for meteoritic fireballs. Automated software maintained by NASA's Meteoroid Environment Office calculates their orbits, velocity, penetration depth in Earth's atmosphere and many other characteristics. Daily results are presented here on Spaceweather.com.
On Oct. 3, 2018, the network reported 40 fireballs.
(40 , 0 sporadics)
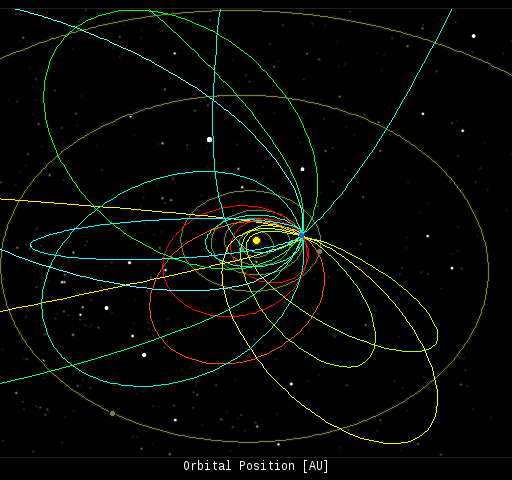
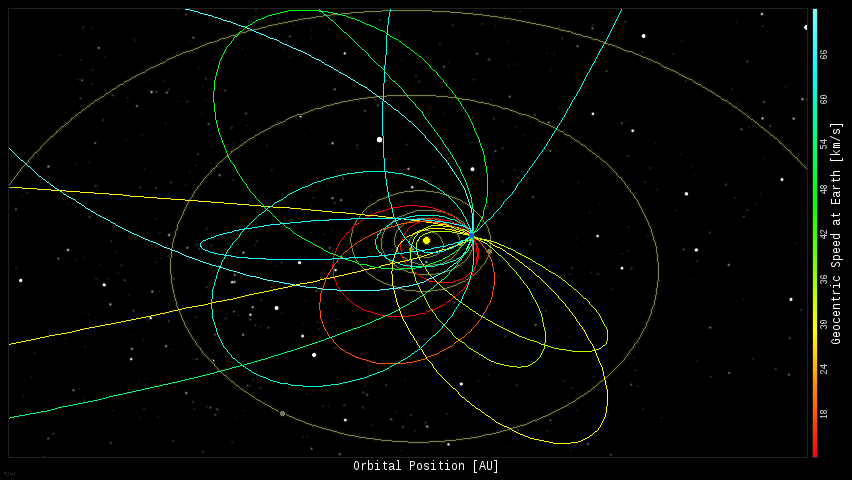
In this diagram of the inner solar system, all of the fireball orbits intersect at a single point--Earth. The orbits are color-coded by velocity, from slow (red) to fast (blue). [Larger image] [movies]
Potentially Hazardous Asteroids (
PHAs) are space rocks larger than approximately 100m that can come closer to Earth than 0.05 AU. None of the known PHAs is on a collision course with our planet, although astronomers are finding
new ones all the time.
On October 3, 2018 there were 1923 potentially hazardous asteroids.
 |
Recent & Upcoming Earth-asteroid encounters: | Asteroid | Date(UT) | Miss Distance | Velocity (km/s) | Diameter (m) |
| 2018 SF2 | 2018-Sep-29 | 3.2 LD | 17.1 | 42 |
| 2018 SE2 | 2018-Sep-30 | 5.9 LD | 11.5 | 41 |
| 2018 SO2 | 2018-Sep-30 | 6.4 LD | 7.6 | 24 |
| 2018 SP2 | 2018-Sep-30 | 2.1 LD | 14.4 | 37 |
| 2018 SM3 | 2018-Oct-02 | 18.5 LD | 8.3 | 30 |
| 2018 SD3 | 2018-Oct-02 | 5.4 LD | 7.7 | 10 |
| 2018 SC3 | 2018-Oct-04 | 6.2 LD | 8 | 22 |
| 2018 SQ2 | 2018-Oct-04 | 18.8 LD | 7.8 | 37 |
| 2018 SP1 | 2018-Oct-04 | 15.3 LD | 16.8 | 87 |
| 2018 EB | 2018-Oct-07 | 15.5 LD | 15.1 | 155 |
| 2018 SG3 | 2018-Oct-08 | 6.7 LD | 5.9 | 13 |
| 2018 SM2 | 2018-Oct-10 | 11.4 LD | 10.1 | 92 |
| 2018 SL3 | 2018-Oct-15 | 9 LD | 13.3 | 35 |
| 2014 US7 | 2018-Oct-17 | 3.2 LD | 8.7 | 19 |
| 2013 UG1 | 2018-Oct-18 | 10.4 LD | 13.4 | 123 |
| 2016 GC221 | 2018-Oct-18 | 8.7 LD | 14.4 | 39 |
| 475534 | 2018-Oct-29 | 7.5 LD | 18.1 | 204 |
| 2002 VE68 | 2018-Nov-04 | 14.7 LD | 8.6 | 282 |
| 2010 VQ | 2018-Nov-07 | 15.6 LD | 3.8 | 10 |
| 2009 WB105 | 2018-Nov-25 | 15.2 LD | 18.9 | 71 |
| 2008 WD14 | 2018-Nov-27 | 7.4 LD | 9.3 | 93 |
| 2001 WO15 | 2018-Nov-28 | 13.6 LD | 11.7 | 107 |
Notes: LD means "Lunar Distance." 1 LD = 384,401 km, the distance between Earth and the Moon. 1 LD also equals 0.00256 AU. MAG is the visual magnitude of the asteroid on the date of closest approach. | | Cosmic Rays in the Atmosphere |
SOMETHING NEW! We have developed a new predictive model of aviation radiation. It's called E-RAD--short for Empirical RADiation model. We are constantly flying radiation sensors onboard airplanes over the US and and around the world, so far collecting more than 22,000 gps-tagged radiation measurements. Using this unique dataset, we can predict the dosage on any flight over the USA with an error no worse than 15%.
E-RAD lets us do something new: Every day we monitor approximately 1400 flights criss-crossing the 10 busiest routes in the continental USA. Typically, this includes more than 80,000 passengers per day. E-RAD calculates the radiation exposure for every single flight.
The Hot Flights Table is a daily summary of these calculations. It shows the 5 charter flights with the highest dose rates; the 5 commercial flights with the highest dose rates; 5 commercial flights with near-average dose rates; and the 5 commercial flights with the lowest dose rates. Passengers typically experience dose rates that are 20 to 70 times higher than natural radiation at sea level.
To measure radiation on airplanes, we use the same sensors we fly to the stratosphere onboard Earth to Sky Calculus cosmic ray balloons: neutron bubble chambers and X-ray/gamma-ray Geiger tubes sensitive to energies between 10 keV and 20 MeV. These energies span the range of medical X-ray machines and airport security scanners.
Column definitions: (1) The flight number; (2) The maximum dose rate during the flight, expressed in units of natural radiation at sea level; (3) The maximum altitude of the plane in feet above sea level; (4) Departure city; (5) Arrival city; (6) Duration of the flight.
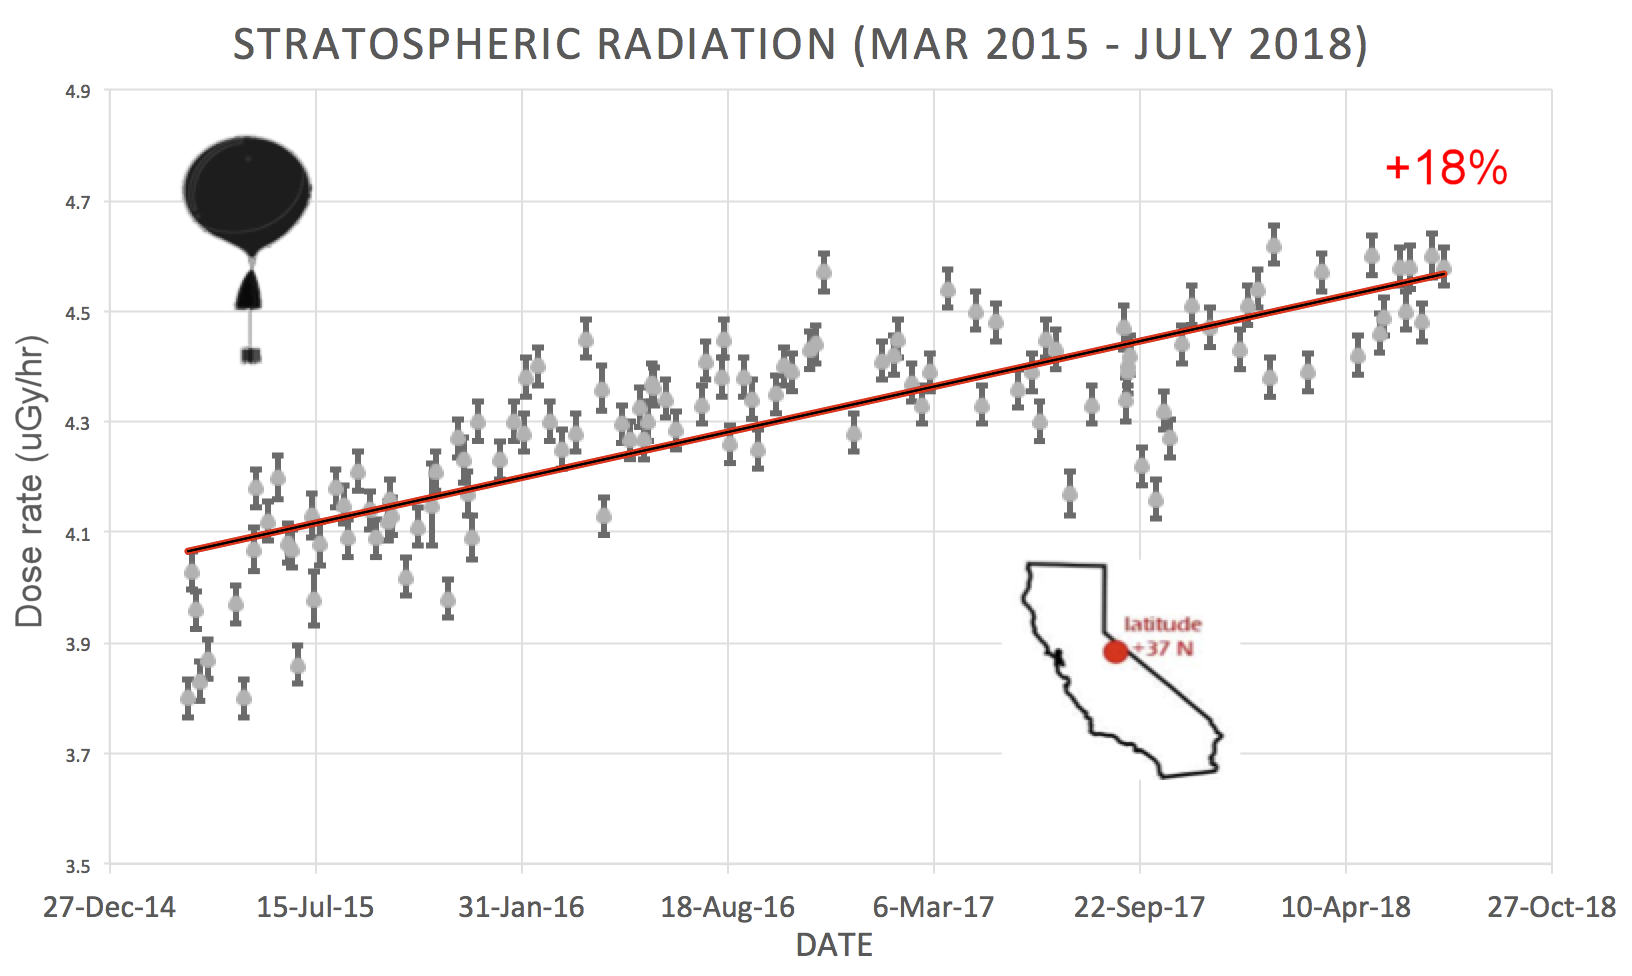
SPACE WEATHER BALLOON DATA: Approximately once a week, Spaceweather.com and the students of Earth to Sky Calculus fly space weather balloons to the stratosphere over California. These balloons are equipped with radiation sensors that detect cosmic rays, a surprisingly "down to Earth" form of space weather. Cosmic rays can seed clouds, trigger lightning, and penetrate commercial airplanes. Furthermore, there are studies ( #1, #2, #3, #4) linking cosmic rays with cardiac arrhythmias and sudden cardiac death in the general population. Our latest measurements show that cosmic rays are intensifying, with an increase of more than 18% since 2015:
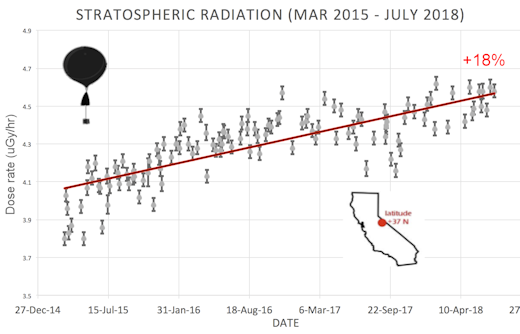
The data points in the graph above correspond to the peak of the Reneger-Pfotzer maximum, which lies about 67,000 feet above central California. When cosmic rays crash into Earth's atmosphere, they produce a spray of secondary particles that is most intense at the entrance to the stratosphere. Physicists Eric Reneger and Georg Pfotzer discovered the maximum using balloons in the 1930s and it is what we are measuring today.
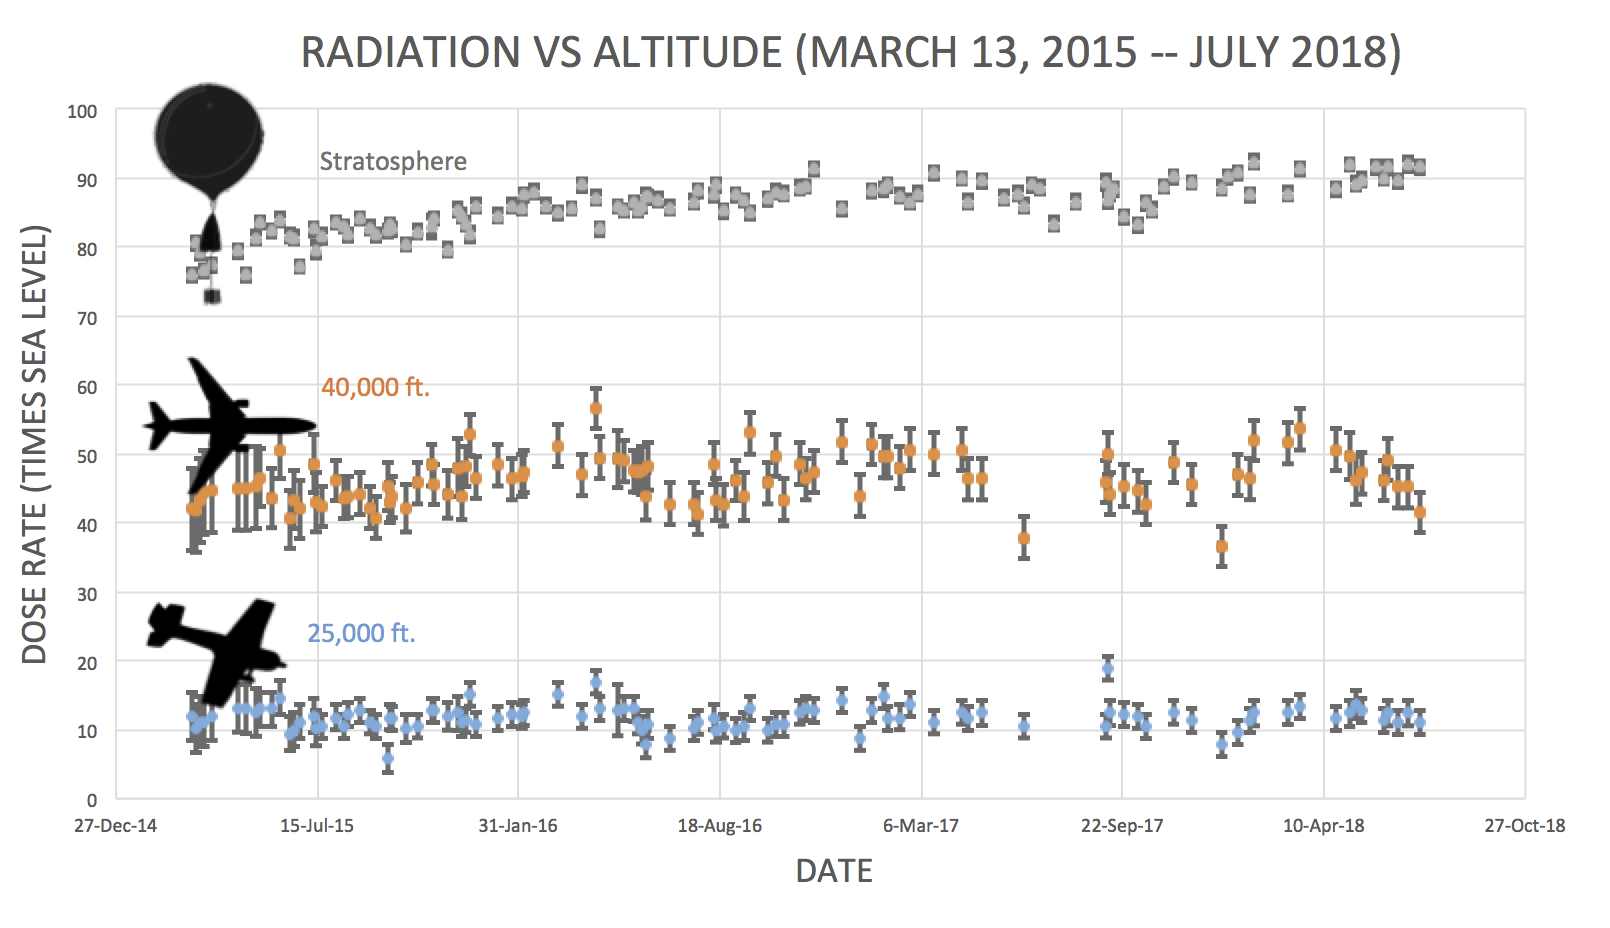
En route to the stratosphere, our sensors also pass through aviation altitudes:
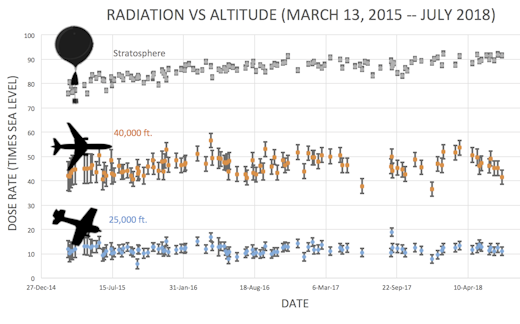
In this plot, dose rates are expessed as multiples of sea level. For instance, we see that boarding a plane that flies at 25,000 feet exposes passengers to dose rates ~10x higher than sea level. At 40,000 feet, the multiplier is closer to 50x.
The radiation sensors onboard our helium balloons detect X-rays and gamma-rays in the energy range 10 keV to 20 MeV. These energies span the range of medical X-ray machines and airport security scanners.
Why are cosmic rays intensifying? The main reason is the sun. Solar storm clouds such as coronal mass ejections (CMEs) sweep aside cosmic rays when they pass by Earth. During Solar Maximum, CMEs are abundant and cosmic rays are held at bay. Now, however, the solar cycle is swinging toward Solar Minimum, allowing cosmic rays to return. Another reason could be the weakening of Earth's magnetic field, which helps protect us from deep-space radiation.
| | The official U.S. government space weather bureau |
| | The first place to look for information about sundogs, pillars, rainbows and related phenomena. |
| | Researchers call it a "Hubble for the sun." SDO is the most advanced solar observatory ever. |
| | 3D views of the sun from NASA's Solar and Terrestrial Relations Observatory |
| | Realtime and archival images of the Sun from SOHO. |
| | from the NOAA Space Environment Center |
| | fun to read, but should be taken with a grain of salt! Forecasts looking ahead more than a few days are often wrong. |
| | from the NOAA Space Environment Center |
| | the underlying science of space weather |
 | If you are a Youtuber and want to buy real Youtube views than try out Buyrealsocial.com for the best results possible! |
| To find reviews of new online casino sites in the UK try The Casino DB where there are hundreds of online casino reviews complete with bonuses and ratings. |
| | These links help Spaceweather.com stay online. Thank you to our supporters! |
| | | | | | |


