All-inclusive Northern Lights trips in Tromsø, Norway. Small groups, big experiences! Highly qualified guides ensure unique and unforgettable adventures with a personal touch. Visit Explore the Arctic | | |
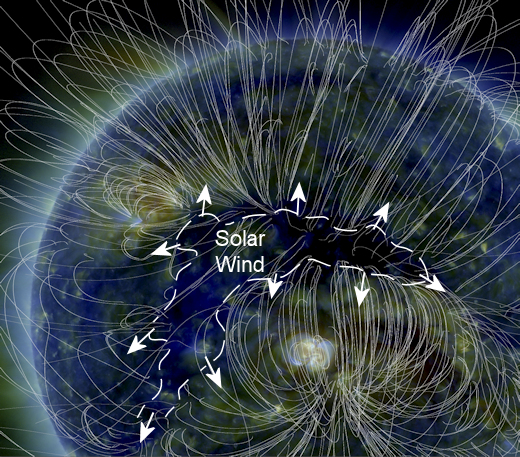
SOLAR WIND ADVISORY: A stream of solar wind flowing from a crescent-shaped hole in the sun's atmosphere has reached Earth and it is now applying pressure to our planet's magnetic field. This could cause geomagnetic disturbances in polar regions on Jan. 21st and 22nd. Arctic sky watchers should remain alert for auroras this weekend. Free: Aurora Alerts.
THE PACIFIC RADIATION BOWL: For years, Spaceweather.com and the students of Earth to Sky Calculus have been flying balloons to the stratosphere to monitor cosmic rays penetrating Earth's atmosphere. Lately, we've been flying the same payloads onboard airplanes. We want to map Earth's radiation environment at aviation altitudes where millions of people are routinely exposed to elevated levels of cosmic rays.
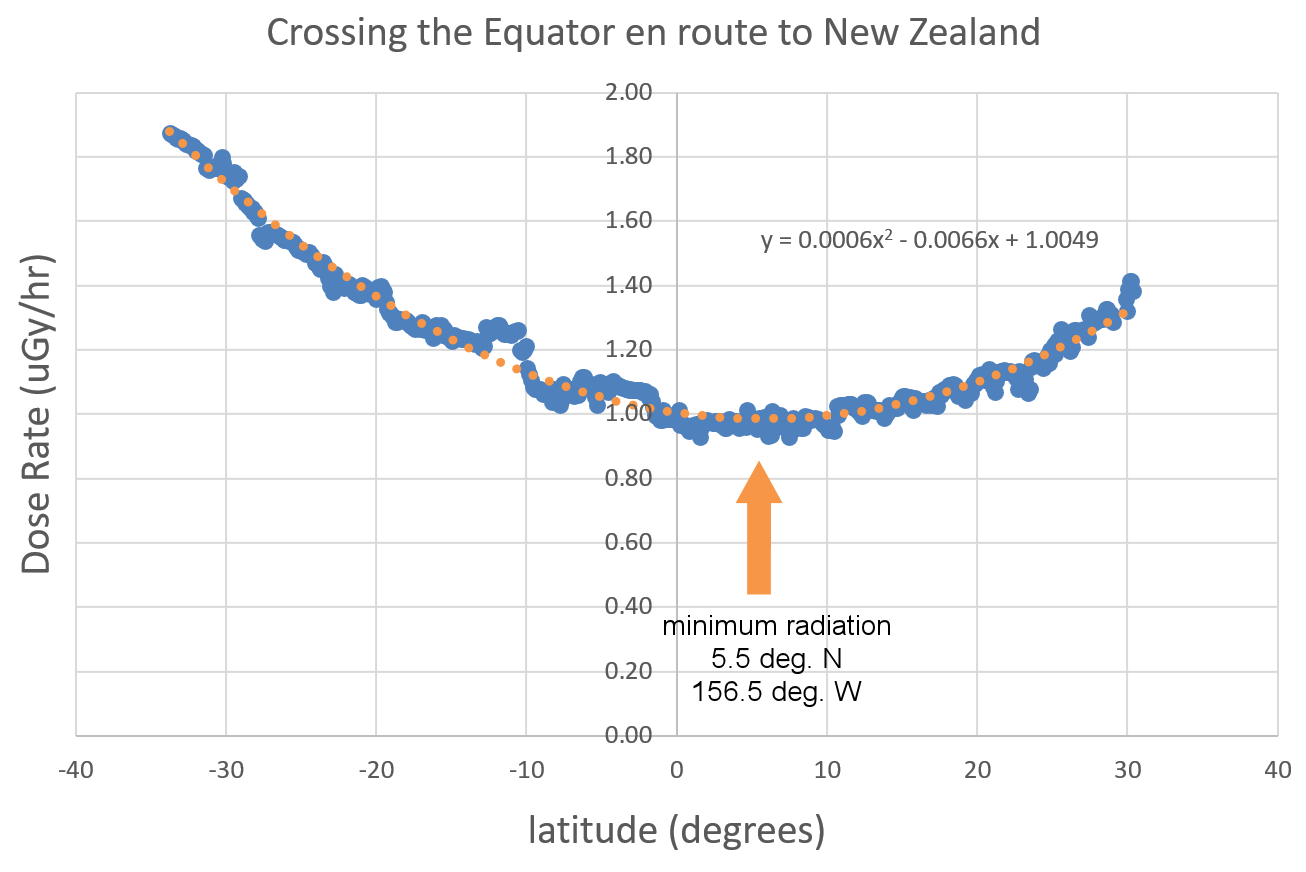
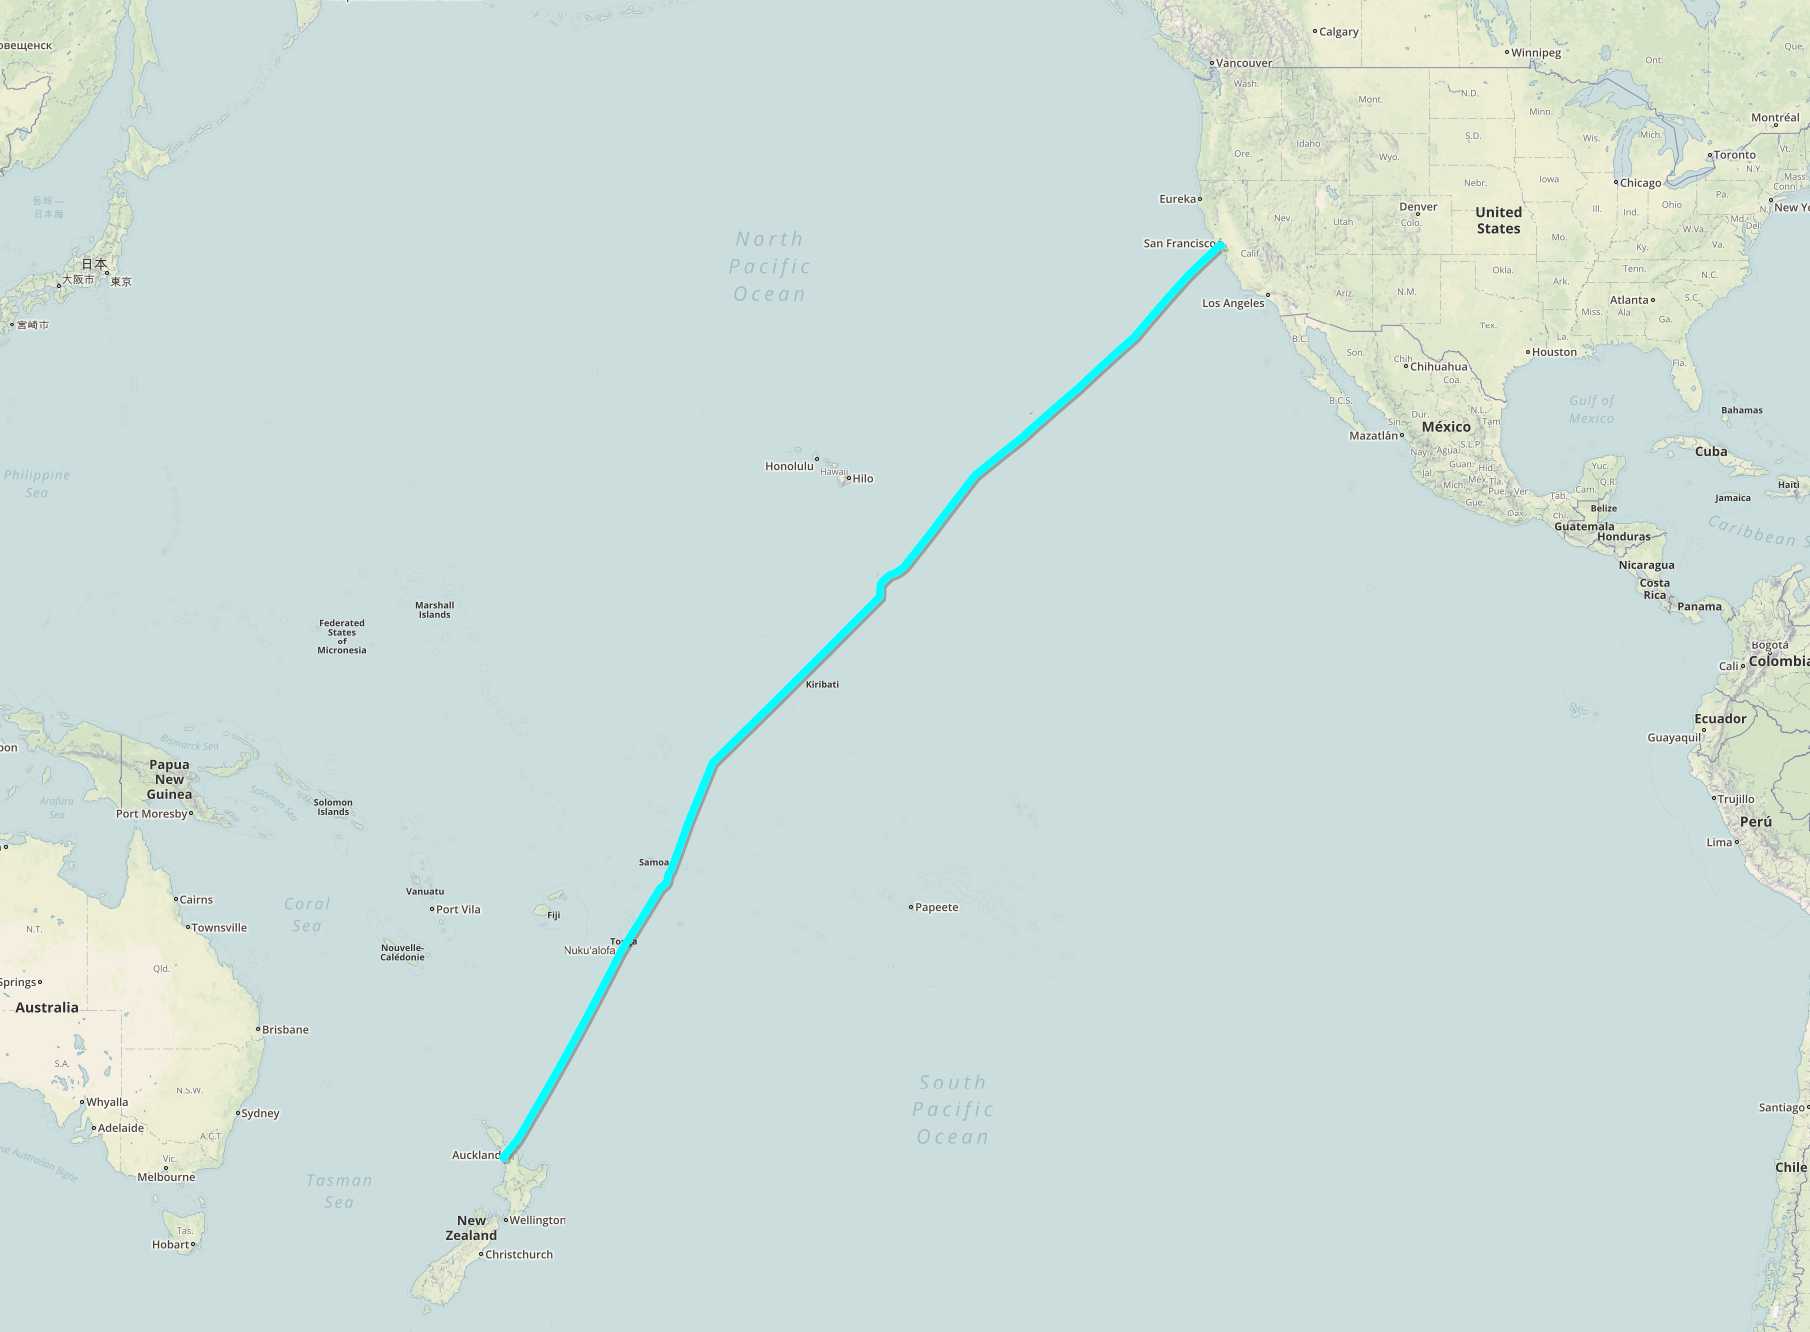
Recently we encountered an interesting feature in data taken over the Pacific Ocean: a "radiation bowl." On Nov. 30th, 2017, Hervey Allen, a computer scientist at the University of Oregon, carried our radiation sensors onboard a commercial flight from San Francisco, California, to Auckland, New Zealand: map. As his plane cruised at a nearly constant altitude (35,000 ft) across the equator, radiation levels gracefully dipped, then recovered, in a bowl-shaped pattern:
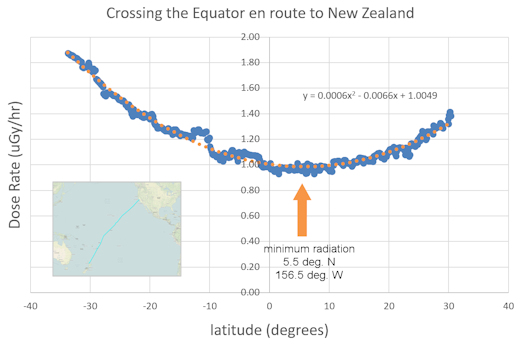
In one way, this beautiful curve is no surprise. We expect dose rates to reach a low point near the equator, because that is where Earth's magnetic field provides the greatest shielding against cosmic rays. Interestingly, however, the low point is not directly above the equator. A parabolic curve fit to the data shows that the actual minimum occurred at 5.5 degrees N latitude.
Is Earth's "radiation equator" offset from the geographic equator? Very likely it is. Earth's magnetic field is tilted with respect to Earth's spin axis and, moreover, there are many inhomogeneities in our planetary magnetic field that may create radiation zones of interest in unexpected places.
We are now planning additional trips across the equator to map the band of least radiation girdling our planet. In fact, we are working on a dataset now that includes an equator-crossing between the USA and Chile. Stay tuned for updates.
Realtime Space Weather Photo Gallery
DOUBLE MAGNETIC SHOCK SPARKS BRIGHT AURORAS: On Friday, Jan. 19th, aurora tour guide Sara Skinner of Abisko, Sweden, kept an expectant eye on the sky because she knew that a solar wind stream was approaching Earth. "I told our guests that a display might begin soon," she says. "What we saw, however, was way beyond what I expected! A crazy vibrant aurora boomed into action, turning everything around us green."
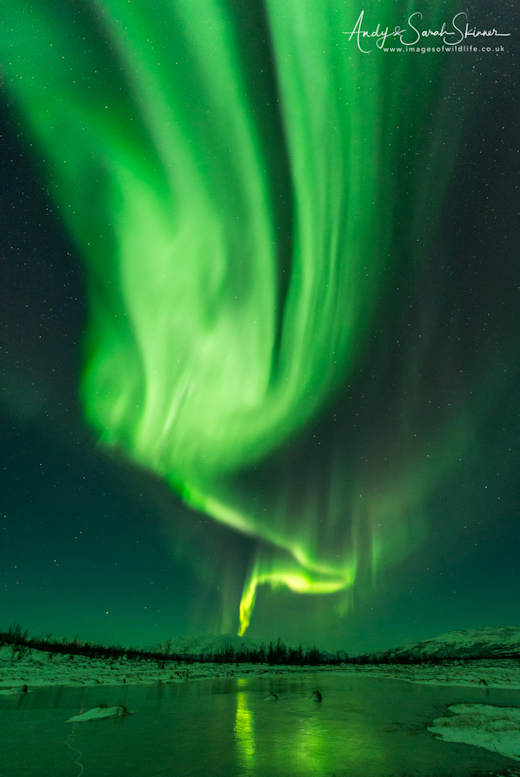
"There are little words to describe what we witnessed for the next two hours," she says. "It was totally awesome!"
The strange thing about this display was not its beauty--stunning auroras are seen routinely in Abisko--but rather its timing. The solar wind stream hadn't yet arrived.
Solar wind speeds wouldn't begin to increase until hours after Skinner witnessed the outburst. What happened? A magnetometer operated by Rob Stammes at the Polarlightcenter in Norway may provide an answer. "My instruments recorded a double magnetic shockwave," he says. "With each pulse of magnetism, electric currents flowed through the ground outside our observatory and bright auroras appeared overhead."
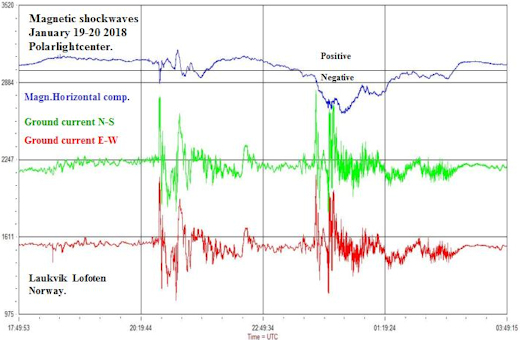
"These signatures are normally associated with CMEs (big explosions on the sun), not solar wind streams flowing from coronal holes," notes Stammes, who has been monitoring magnetic activity in Arctic Norway for decades.
The pulses Stammes recorded may have been delivered by a co-rotating interaction region (CIR). CIRs are transition zones between slow- and fast-moving regions of solar wind, often traveling just ahead of solar wind streams. They contain shock-like density gradients and enhanced magnetic fields that can sometimes mimic the effect of more powerful CMEs.
Meanwhile, the solar wind has arrived, so more Arctic auroras are likely tonight. Stay tuned. Free: Aurora Alerts.
Realtime Aurora Photo Gallery
VALENTINE'S DAY IS COMING: Nothing says "I Love You" like a Valentine's pendant from the edge of space. On Dec. 31, 2017, the students of Earth to Sky Calculus flew a payload-full of these heart-shaped pendants to the stratosphere, 35.1 km (115,158 feet) above Earth's surface:
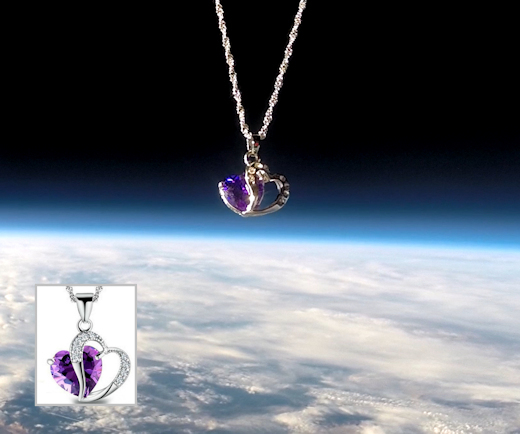
You can have one for $119.95. Each glittering pendant comes with a greeting card showing the jewelry in flight and telling the story of its journey to the edge of space. Sales of this pendant support the Earth to Sky Calculus cosmic ray ballooning program and hands-on STEM research.
Far Out Gifts: Earth to Sky Store
All proceeds support hands-on STEM education
NOCTILUCENT ROCKET FUMES OVER JAPAN: On Jan. 18th, the Japanese space agency JAXA launched a small rocket from the Uchinoura Space Center. It made a big display. Japanese artist and photographer Kagaya captured dramatic images of the rocket's exhaust glowing in the starry pre-dawn sky over the Pacific:
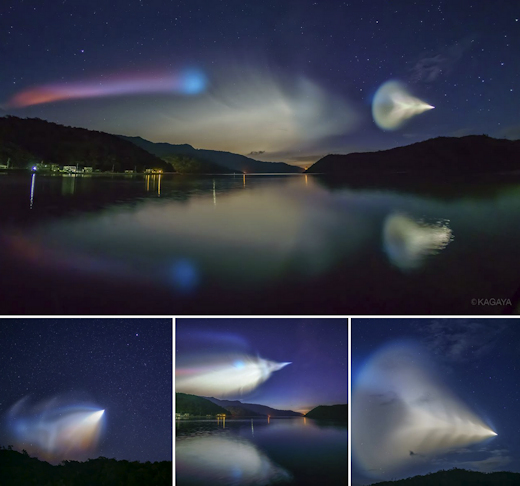
"I watched the launch from Okinawa Island and photographed it using my Sony α7RIII camera," says Kagaya, who has posted a must-see video of the event on Youtube.
Japan's new Epsilon rocket is relatively small, designed to launch scientific satellites at a fraction of the cost of its larger predecessors. On this occasion, the Epsilon propelled an Earth observing satellite to orbit, the ASNARO-2. Powered by solar cells and carrying a large X-band antenna, ASNARO-2 is a synthetic aperture radar capable of imaging the surface of our planet with 1-meter resolution.
Shortly after the launch, noctilucent (night shining) clouds were seen over a broad swath of western Japan as ice crystals forming in the rocket's wake caught the rays of the rising sun. These clouds occur naturally around Earth's poles, but they are very rare at lower latitudes such as Japan's. In polar regions, noctilucent clouds are seeded by specks of meteor smoke, which become frosted by naturally occurring water vapor drifting up toward the edge of space. Over Japan, the ingredients were provided by JAXA: water vapor in the rocket's exhaust mixed with solid-booster aerosols to create the display.
Noctilucent clouds (both manmade and natural) are of keen interest to scientists because of what they reveal about long-range teleconnections and climate change in Earth's atmosphere. Read more here.
Every night, a network of
NASA all-sky cameras scans the skies above the United States for meteoritic fireballs. Automated software maintained by NASA's Meteoroid Environment Office calculates their orbits, velocity, penetration depth in Earth's atmosphere and many other characteristics. Daily results are presented here on Spaceweather.com.
On Jan. 21, 2018, the network reported 4 fireballs.
(4 sporadics)
In this diagram of the inner solar system, all of the fireball orbits intersect at a single point--Earth. The orbits are color-coded by velocity, from slow (red) to fast (blue). [Larger image] [movies]
Potentially Hazardous Asteroids (
PHAs) are space rocks larger than approximately 100m that can come closer to Earth than 0.05 AU. None of the known PHAs is on a collision course with our planet, although astronomers are finding
new ones all the time.
On January 21, 2018 there were 1882 potentially hazardous asteroids.
 |
Recent & Upcoming Earth-asteroid encounters: | Asteroid | Date(UT) | Miss Distance | Velocity (km/s) | Diameter (m) |
| 2018 BB | 2018-Jan-15 | 10.9 LD | 8.9 | 36 |
| 2018 AA12 | 2018-Jan-15 | 16.6 LD | 7.6 | 39 |
| 2018 AV2 | 2018-Jan-15 | 6.7 LD | 0.1 | 6 |
| 2018 BW | 2018-Jan-15 | 0.4 LD | 6.9 | 9 |
| 2018 AT11 | 2018-Jan-15 | 10.9 LD | 6.9 | 32 |
| 2018 BW1 | 2018-Jan-16 | 8.7 LD | 6.3 | 14 |
| 2018 BR1 | 2018-Jan-16 | 0.3 LD | 8.9 | 4 |
| 2018 AM2 | 2018-Jan-16 | 12.2 LD | 13.5 | 23 |
| 2018 AG4 | 2018-Jan-17 | 1.4 LD | 9.2 | 23 |
| 2018 BA | 2018-Jan-17 | 17.3 LD | 12.9 | 37 |
| 2018 BD | 2018-Jan-18 | 0.1 LD | 10 | 3 |
| 2018 AF1 | 2018-Jan-18 | 12.4 LD | 24.6 | 90 |
| 2018 BC | 2018-Jan-19 | 0.7 LD | 2.7 | 5 |
| 2018 BX | 2018-Jan-19 | 0.7 LD | 5.8 | 6 |
| 306383 | 2018-Jan-22 | 14.4 LD | 17.4 | 178 |
| 2018 AK12 | 2018-Jan-23 | 7 LD | 22.3 | 33 |
| 2018 BT1 | 2018-Jan-23 | 15.3 LD | 16.7 | 92 |
| 2018 AV11 | 2018-Jan-23 | 11.1 LD | 9.1 | 35 |
| 2018 AJ | 2018-Jan-23 | 4.7 LD | 5.6 | 42 |
| 2018 BG1 | 2018-Jan-24 | 10.9 LD | 7.3 | 28 |
| 2018 BP1 | 2018-Jan-24 | 19.2 LD | 8.2 | 48 |
| 2018 AL12 | 2018-Jan-26 | 8 LD | 19.4 | 36 |
| 2018 BU1 | 2018-Jan-27 | 3.1 LD | 11.3 | 44 |
| 2018 BQ | 2018-Jan-27 | 9.3 LD | 3.4 | 27 |
| 2018 AQ2 | 2018-Feb-02 | 13.5 LD | 17.4 | 129 |
| 2002 CB19 | 2018-Feb-02 | 10.5 LD | 15.6 | 36 |
| 2018 AH12 | 2018-Feb-04 | 5.3 LD | 5 | 15 |
| 276033 | 2018-Feb-04 | 11 LD | 34 | 646 |
| 2018 BL1 | 2018-Feb-09 | 16.6 LD | 20.4 | 77 |
| 2015 BN509 | 2018-Feb-09 | 12.9 LD | 17.7 | 257 |
| 1991 VG | 2018-Feb-11 | 18.4 LD | 2.1 | 7 |
| 2014 WQ202 | 2018-Feb-11 | 15.1 LD | 19.8 | 62 |
| 2016 CO246 | 2018-Feb-22 | 15.3 LD | 5.4 | 21 |
| 2017 DR109 | 2018-Feb-24 | 3.7 LD | 7.4 | 11 |
| 2016 FU12 | 2018-Feb-26 | 13.2 LD | 4.5 | 15 |
| 2014 EY24 | 2018-Feb-27 | 14.8 LD | 8 | 54 |
| 2015 BF511 | 2018-Feb-28 | 11.7 LD | 5.7 | 39 |
| 2003 EM1 | 2018-Mar-07 | 16.6 LD | 8 | 45 |
| 2017 VR12 | 2018-Mar-07 | 3.8 LD | 6.3 | 284 |
| 2015 DK200 | 2018-Mar-10 | 6.9 LD | 8 | 27 |
Notes: LD means "Lunar Distance." 1 LD = 384,401 km, the distance between Earth and the Moon. 1 LD also equals 0.00256 AU. MAG is the visual magnitude of the asteroid on the date of closest approach. | | Cosmic Rays in the Atmosphere |
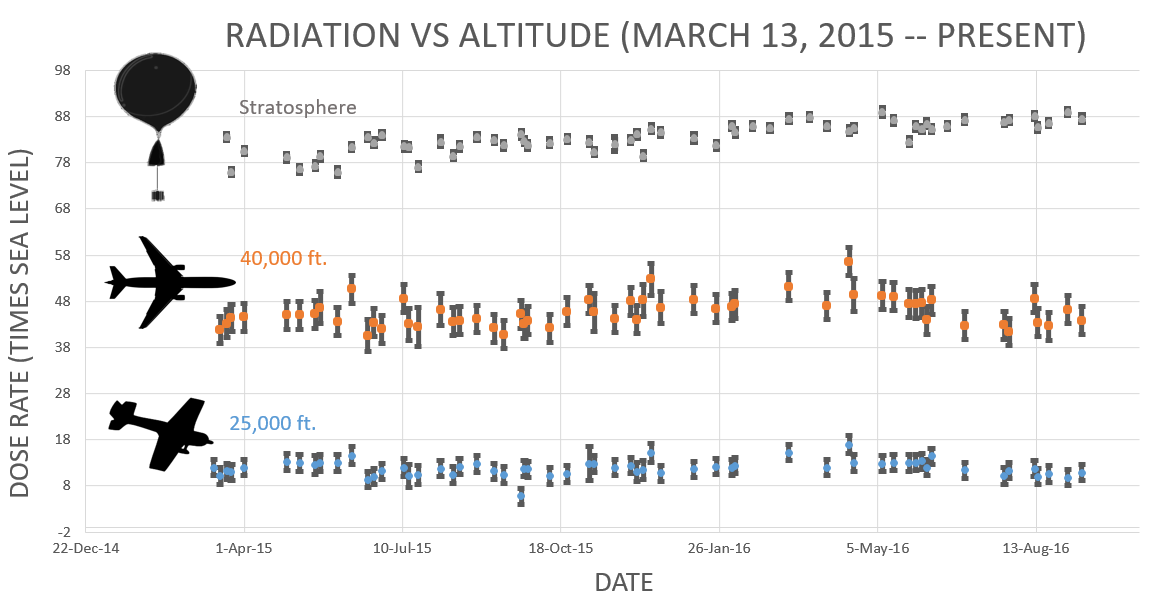
Readers, thank you for your patience while we continue to develop this new section of Spaceweather.com. We've been working to streamline our data reduction, allowing us to post results from balloon flights much more rapidly, and we have developed a new data product, shown here:
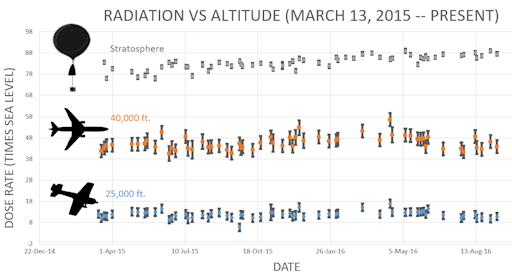
This plot displays radiation measurements not only in the stratosphere, but also at aviation altitudes. Dose rates are expessed as multiples of sea level. For instance, we see that boarding a plane that flies at 25,000 feet exposes passengers to dose rates ~10x higher than sea level. At 40,000 feet, the multiplier is closer to 50x. These measurements are made by our usual cosmic ray payload as it passes through aviation altitudes en route to the stratosphere over California.
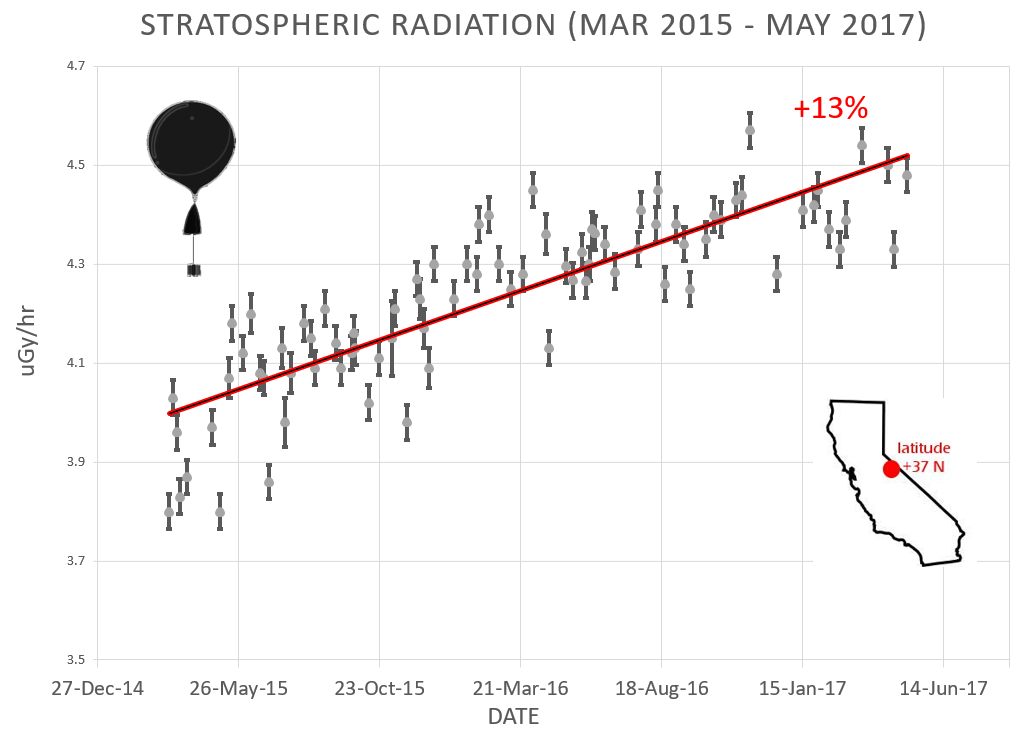
What is this all about? Approximately once a week, Spaceweather.com and the students of Earth to Sky Calculus fly space weather balloons to the stratosphere over California. These balloons are equipped with radiation sensors that detect cosmic rays, a surprisingly "down to Earth" form of space weather. Cosmic rays can seed clouds, trigger lightning, and penetrate commercial airplanes. Furthermore, there are studies ( #1, #2, #3, #4) linking cosmic rays with cardiac arrhythmias and sudden cardiac death in the general population. Our latest measurements show that cosmic rays are intensifying, with an increase of more than 13% since 2015:
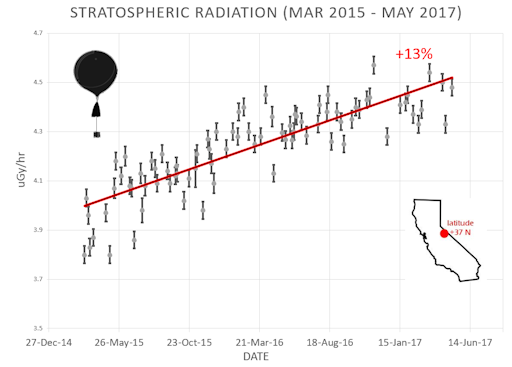
Why are cosmic rays intensifying? The main reason is the sun. Solar storm clouds such as coronal mass ejections (CMEs) sweep aside cosmic rays when they pass by Earth. During Solar Maximum, CMEs are abundant and cosmic rays are held at bay. Now, however, the solar cycle is swinging toward Solar Minimum, allowing cosmic rays to return. Another reason could be the weakening of Earth's magnetic field, which helps protect us from deep-space radiation.
The radiation sensors onboard our helium balloons detect X-rays and gamma-rays in the energy range 10 keV to 20 MeV. These energies span the range of medical X-ray machines and airport security scanners.
The data points in the graph above correspond to the peak of the Reneger-Pfotzer maximum, which lies about 67,000 feet above central California. When cosmic rays crash into Earth's atmosphere, they produce a spray of secondary particles that is most intense at the entrance to the stratosphere. Physicists Eric Reneger and Georg Pfotzer discovered the maximum using balloons in the 1930s and it is what we are measuring today.
| | The official U.S. government space weather bureau |
| | The first place to look for information about sundogs, pillars, rainbows and related phenomena. |
| | Researchers call it a "Hubble for the sun." SDO is the most advanced solar observatory ever. |
| | 3D views of the sun from NASA's Solar and Terrestrial Relations Observatory |
| | Realtime and archival images of the Sun from SOHO. |
| | from the NOAA Space Environment Center |
| | fun to read, but should be taken with a grain of salt! Forecasts looking ahead more than a few days are often wrong. |
| | from the NOAA Space Environment Center |
| | the underlying science of space weather |
 | Reviews here can help you to pick up best memory foam mattresses. |
| | These links help Spaceweather.com stay online. Thank you to our supporters! |
| | | | | | |


