Solar minimum is here - but even now strangely beautiful auroras are dancing around the poles. Deep inside the Arctic Circle, the expert guides of Aurora Holidays in Utsjoki, Finland, can help you chase them. Book now! | | |
THE SOLAR WIND IS HERE: Earth is inside a stream of solar wind flowing faster than 500 km/s (1.1 million mph). This is causing geomagnetic unrest and intermittent auroras around the Arctic Circle. Solar wind speeds should remain elevated for the next 48 to 72 hours as our planet surfs two additional streams of solar wind in the offing. Aurora alerts: SMS text, email.
SPACE WEATHER PROBES SHATTER GPS RECORD: NASA's MMS probes, which use GPS signals to orbit Earth in tight formation, have just shattered the record for long-distance GPS navigation. The four probes recently located themselves 116,300 miles above Earth's surface, surprising experts who once thought that GPS could function no higher than about 22,000 miles.
"When we began the mission, we had no idea high-altitude GPS would be such a robust capability," says Trevor Williams, the MMS flight dynamics lead at NASA's Goddard Space Flight Center.
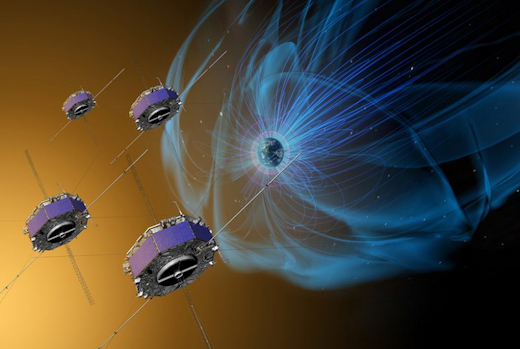
Above: an artist's concept of the 4 MMS spacecraft
MMS, short for "Magnetospheric Multiscale," is a constellation of 4 spacecraft launched in 2015. They are on a mission to study magnetic explosions in our planet's magnetosphere. High above Earth where the magnetic field is buffeted by solar wind, magnetic lines of force criss-cross, reconnect and—Bang! Magnetic energy is unleashed, with charged-particles flying off near the speed of light. The process is called "magnetic reconnection, and it serves as a power source for geomagnetic storms.
To study the inner physics of reconnection, the MMS probes must fly in precise formation, as close as 10 km apart, so that they can sample particles and fields inside the tight reconnection zone. With the aid of GPS, the fleet maintain formation with an accuracy of only 100 meters, which is crucial to their measurements.
GPS satellites are not designed to assist spacecraft. They focus their radio energy on Earth where we use the signals for terrestrial navigation. So how do the MMS probes do it? The answer is "side lobes." This diagram shows a simplified but typical GPS antenna pattern:
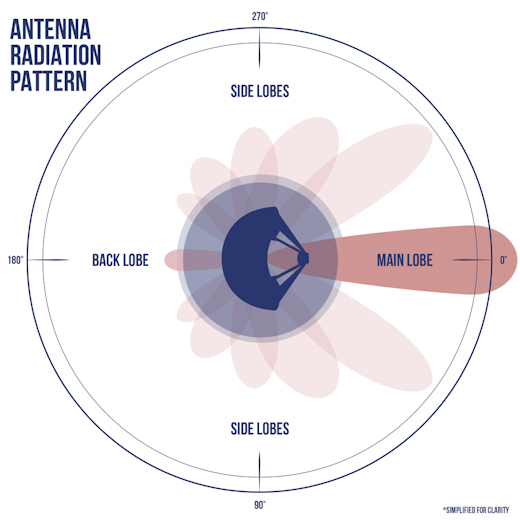
All GPS antennas allow a little bit of radio energy to leak out in unwanted directions through side lobes. Receivers on the MMS probes tap into the leaked signal and use it to locate themselves. The first time MMS attempted navigation at the extremes of its orbit, the satellites had as many as 12 GPS fixes, each requiring signals from four GPS satellites. Not bad for a "leak."
This type of navigation could reach all the way to the Moon. NASA analysts have run simulations suggesting that all six international GPS-like constellations (collectively known as GNSS) when working together could guide spacecraft in lunar orbit 238,000 miles from Earth. NASA is even considering adding GPS navigation to its proposed Gateway outpost, a space station for the Moon.
A sharable version of this story is available here.
Realtime Space Weather Photo Gallery
SOLAR ECLIPSE ON MARS: When NASA's Curiosity rover landed on Mars in 2012, it brought along eclipse glasses. The solar filters on its Mast Camera (Mastcam) allow it to stare directly at the sun. On March 26th, the rover witnessed a distinctly Martian solar eclipse:
These images show the Martian moon Phobos crossing the sun over a period of about 35 seconds. Measuring only 25 km across, Phobos has an irregular silhouette that fails to blot out the entire solar disk. Nevertheless, Curiosity was able to see the moon's shadow sweeping across the landscape.
Fun fact: Phobos is doomed. Phobos orbits so close to Mars - about 5800 kilometers above the surface compared to 400,000 kilometers for our Moon - that gravitational tidal forces are dragging it down. The ultimate result will be for Phobos to break up in orbit and then crash down onto the Martian surface in about 50 million years.
Realtime Space Weather Photo Gallery
A GIFT FROM THE EDGE OF SPACE: It's sterling silver and it comes from space. On March 5th, the students of Earth to Sky Calculus flew a cosmic ray balloon to the stratosphere, more than 94,000 feet above Earth's surface. This "Loving Hands" pendant went along for the ride:
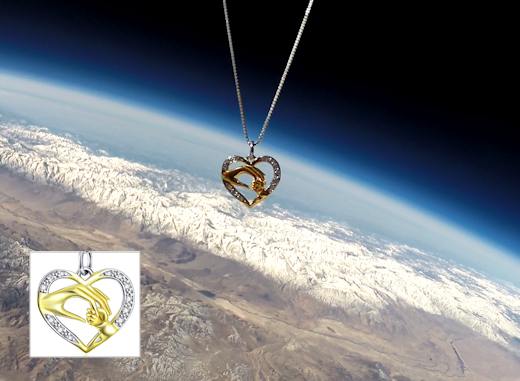
You can have one for $129.95. They make great Mother's Day gifts. The students are selling these pendants as a fund-raiser for their cosmic ray monitoring program. All proceeds support atmospheric radiation measurements and hands-on STEM education.
Each pendant comes with a greeting card showing the jewelry in flight and telling the story of its journey to the stratosphere and back again.
Far Out Gifts: Earth to Sky Store
All sales support hands-on STEM education
Realtime Space Weather Photo Gallery
Realtime Aurora Photo Gallery
Every night, a network of
NASA all-sky cameras scans the skies above the United States for meteoritic fireballs. Automated software maintained by NASA's Meteoroid Environment Office calculates their orbits, velocity, penetration depth in Earth's atmosphere and many other characteristics. Daily results are presented here on Spaceweather.com.
On Apr. 5, 2019, the network reported 25 fireballs.
(25 sporadics)
In this diagram of the inner solar system, all of the fireball orbits intersect at a single point--Earth. The orbits are color-coded by velocity, from slow (red) to fast (blue). [Larger image] [movies]
Potentially Hazardous Asteroids (
PHAs) are space rocks larger than approximately 100m that can come closer to Earth than 0.05 AU. None of the known PHAs is on a collision course with our planet, although astronomers are finding
new ones all the time.
On April 5, 2019 there were 1967 potentially hazardous asteroids.
 |
Recent & Upcoming Earth-asteroid encounters: | Asteroid | Date(UT) | Miss Distance | Velocity (km/s) | Diameter (m) |
| 2019 FV1 | 2019-Mar-31 | 0.9 LD | 18.3 | 6 |
| 2019 FL1 | 2019-Mar-31 | 2.8 LD | 12.5 | 15 |
| 2019 GJ1 | 2019-Mar-31 | 5.4 LD | 7.5 | 14 |
| 2019 FB1 | 2019-Mar-31 | 1.5 LD | 8.2 | 10 |
| 2019 FZ1 | 2019-Mar-31 | 11.3 LD | 24.3 | 29 |
| 2019 FF1 | 2019-Mar-31 | 18.7 LD | 8.4 | 28 |
| 2019 FQ1 | 2019-Mar-31 | 9.2 LD | 9.3 | 12 |
| 2019 GE | 2019-Mar-31 | 2.9 LD | 10.7 | 18 |
| 2019 FR2 | 2019-Apr-01 | 2.1 LD | 8.3 | 11 |
| 2019 FN1 | 2019-Apr-02 | 8.5 LD | 9 | 14 |
| 2019 FT2 | 2019-Apr-02 | 2.4 LD | 27.1 | 19 |
| 2019 GK1 | 2019-Apr-04 | 19.8 LD | 5.6 | 18 |
| 2019 GM1 | 2019-Apr-04 | 7.9 LD | 4.4 | 12 |
| 2019 FW1 | 2019-Apr-04 | 16.8 LD | 8.3 | 18 |
| 2016 GE1 | 2019-Apr-05 | 2.9 LD | 10.1 | 17 |
| 2019 FV | 2019-Apr-06 | 15 LD | 7.7 | 59 |
| 2019 FY2 | 2019-Apr-07 | 19.5 LD | 3.9 | 12 |
| 2019 GT | 2019-Apr-07 | 3.5 LD | 15.6 | 18 |
| 2019 GS | 2019-Apr-07 | 1.1 LD | 12.7 | 17 |
| 2019 FS2 | 2019-Apr-08 | 3.2 LD | 6.2 | 12 |
| 2019 GR | 2019-Apr-08 | 11.4 LD | 5.7 | 29 |
| 2019 GC | 2019-Apr-08 | 6.2 LD | 6.6 | 17 |
| 2019 FU | 2019-Apr-09 | 5.3 LD | 14.2 | 85 |
| 2014 UR | 2019-Apr-09 | 13 LD | 4.6 | 17 |
| 2016 GW221 | 2019-Apr-09 | 10.1 LD | 5.3 | 39 |
| 2014 HD177 | 2019-Apr-10 | 6.1 LD | 14 | 102 |
| 2019 GQ | 2019-Apr-10 | 5.2 LD | 8.4 | 17 |
| 2019 GE1 | 2019-Apr-11 | 3.9 LD | 6.5 | 13 |
| 2019 FB3 | 2019-Apr-12 | 11.9 LD | 14.2 | 42 |
| 2019 GQ1 | 2019-Apr-12 | 13.4 LD | 12.7 | 38 |
| 2019 GN | 2019-Apr-13 | 1.7 LD | 11.8 | 12 |
| 2019 FO1 | 2019-Apr-13 | 14.4 LD | 9.7 | 28 |
| 2019 FH1 | 2019-Apr-13 | 18 LD | 3.8 | 32 |
| 2012 XO134 | 2019-Apr-18 | 14.8 LD | 11 | 56 |
| 2019 FN2 | 2019-Apr-18 | 4.1 LD | 7.8 | 69 |
| 522684 | 2019-Apr-19 | 19 LD | 11.5 | 214 |
| 2019 GM | 2019-Apr-21 | 19.4 LD | 10.3 | 38 |
| 2019 FV2 | 2019-Apr-22 | 15.6 LD | 2.3 | 32 |
| 2019 GF1 | 2019-Apr-27 | 4.7 LD | 1.9 | 11 |
| 2018 KK1 | 2019-May-05 | 13.9 LD | 13.9 | 71 |
| 2017 RC | 2019-May-09 | 14.5 LD | 10.6 | 9 |
| 2008 HS3 | 2019-May-09 | 14.6 LD | 5.3 | 162 |
| 2018 VX8 | 2019-May-12 | 6.2 LD | 15.5 | 118 |
| 2012 KT12 | 2019-May-18 | 3.3 LD | 3.9 | 20 |
| 2015 KQ18 | 2019-May-25 | 10.7 LD | 13.1 | 30 |
| 66391 | 2019-May-25 | 13.5 LD | 21.5 | 1780 |
| 2003 LH | 2019-May-28 | 15.6 LD | 7.4 | 32 |
| 2011 HP | 2019-May-30 | 12.2 LD | 8.4 | 135 |
Notes: LD means "Lunar Distance." 1 LD = 384,401 km, the distance between Earth and the Moon. 1 LD also equals 0.00256 AU. MAG is the visual magnitude of the asteroid on the date of closest approach. | | Cosmic Rays in the Atmosphere |
SOMETHING NEW! We have developed a new predictive model of aviation radiation. It's called E-RAD--short for Empirical RADiation model. We are constantly flying radiation sensors onboard airplanes over the US and and around the world, so far collecting more than 22,000 gps-tagged radiation measurements. Using this unique dataset, we can predict the dosage on any flight over the USA with an error no worse than 15%.
E-RAD lets us do something new: Every day we monitor approximately 1400 flights criss-crossing the 10 busiest routes in the continental USA. Typically, this includes more than 80,000 passengers per day. E-RAD calculates the radiation exposure for every single flight.
The Hot Flights Table is a daily summary of these calculations. It shows the 5 charter flights with the highest dose rates; the 5 commercial flights with the highest dose rates; 5 commercial flights with near-average dose rates; and the 5 commercial flights with the lowest dose rates. Passengers typically experience dose rates that are 20 to 70 times higher than natural radiation at sea level.
To measure radiation on airplanes, we use the same sensors we fly to the stratosphere onboard Earth to Sky Calculus cosmic ray balloons: neutron bubble chambers and X-ray/gamma-ray Geiger tubes sensitive to energies between 10 keV and 20 MeV. These energies span the range of medical X-ray machines and airport security scanners.
Column definitions: (1) The flight number; (2) The maximum dose rate during the flight, expressed in units of natural radiation at sea level; (3) The maximum altitude of the plane in feet above sea level; (4) Departure city; (5) Arrival city; (6) Duration of the flight.
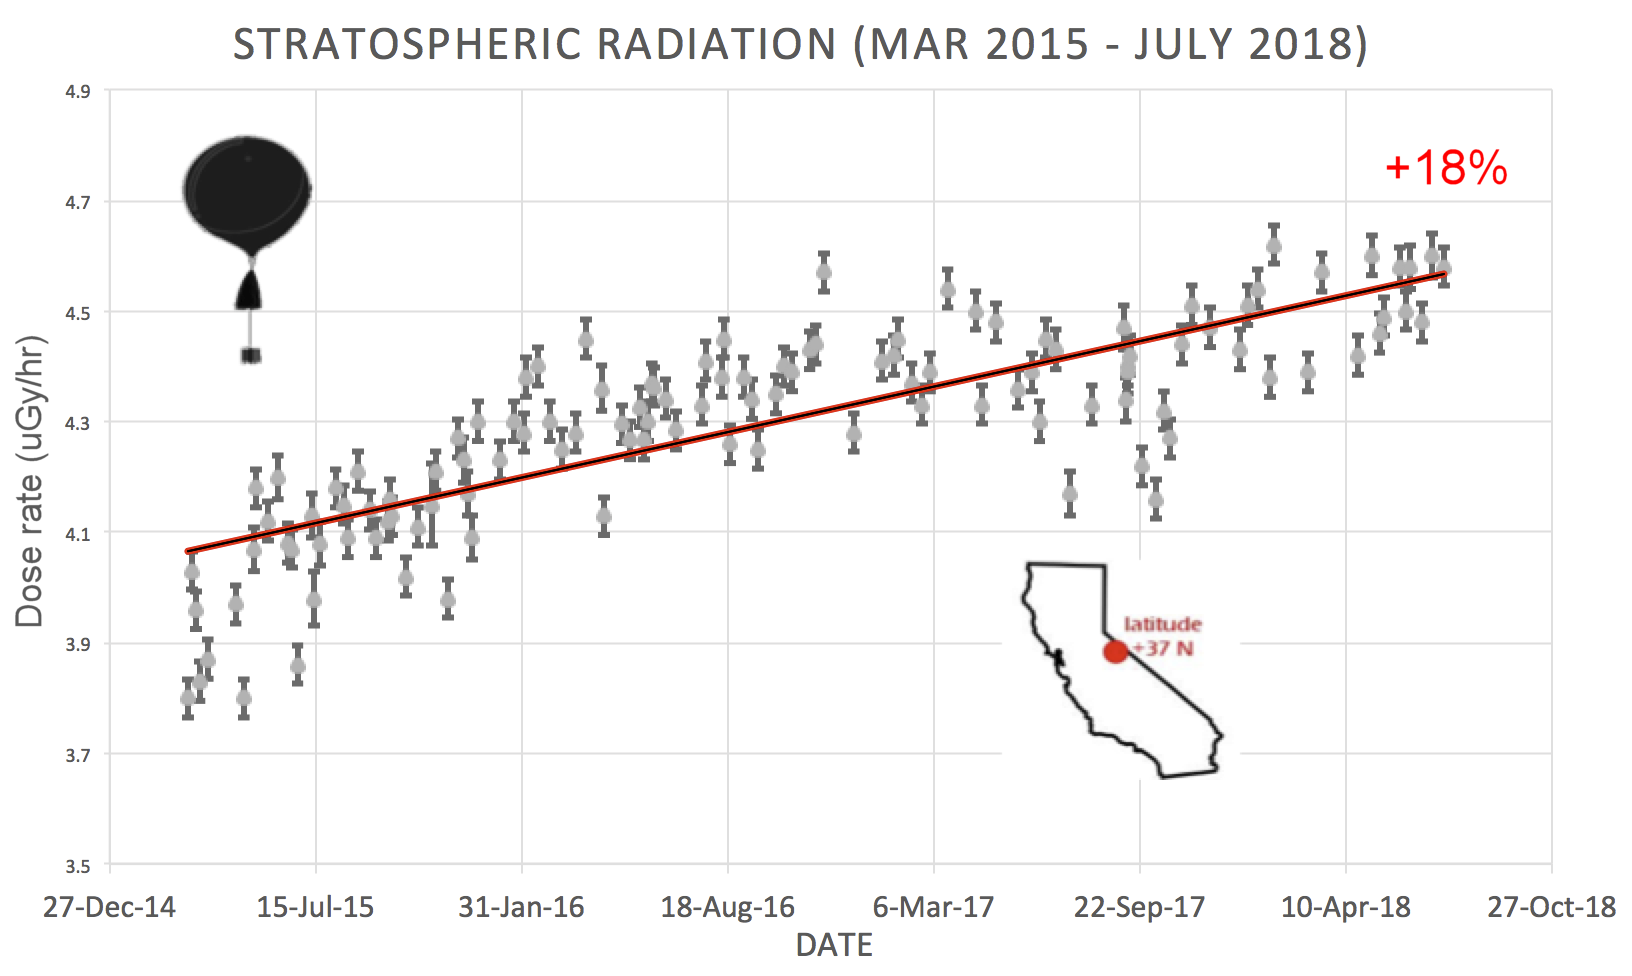
SPACE WEATHER BALLOON DATA: Approximately once a week, Spaceweather.com and the students of Earth to Sky Calculus fly space weather balloons to the stratosphere over California. These balloons are equipped with radiation sensors that detect cosmic rays, a surprisingly "down to Earth" form of space weather. Cosmic rays can seed clouds, trigger lightning, and penetrate commercial airplanes. Furthermore, there are studies ( #1, #2, #3, #4) linking cosmic rays with cardiac arrhythmias and sudden cardiac death in the general population. Our latest measurements show that cosmic rays are intensifying, with an increase of more than 18% since 2015:
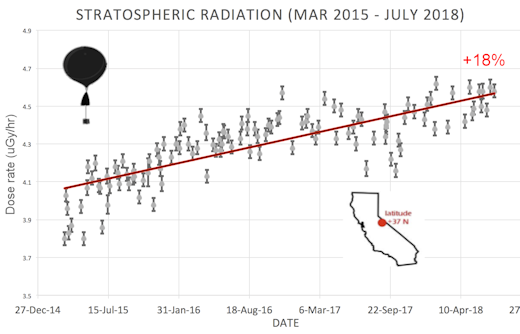
The data points in the graph above correspond to the peak of the Reneger-Pfotzer maximum, which lies about 67,000 feet above central California. When cosmic rays crash into Earth's atmosphere, they produce a spray of secondary particles that is most intense at the entrance to the stratosphere. Physicists Eric Reneger and Georg Pfotzer discovered the maximum using balloons in the 1930s and it is what we are measuring today.
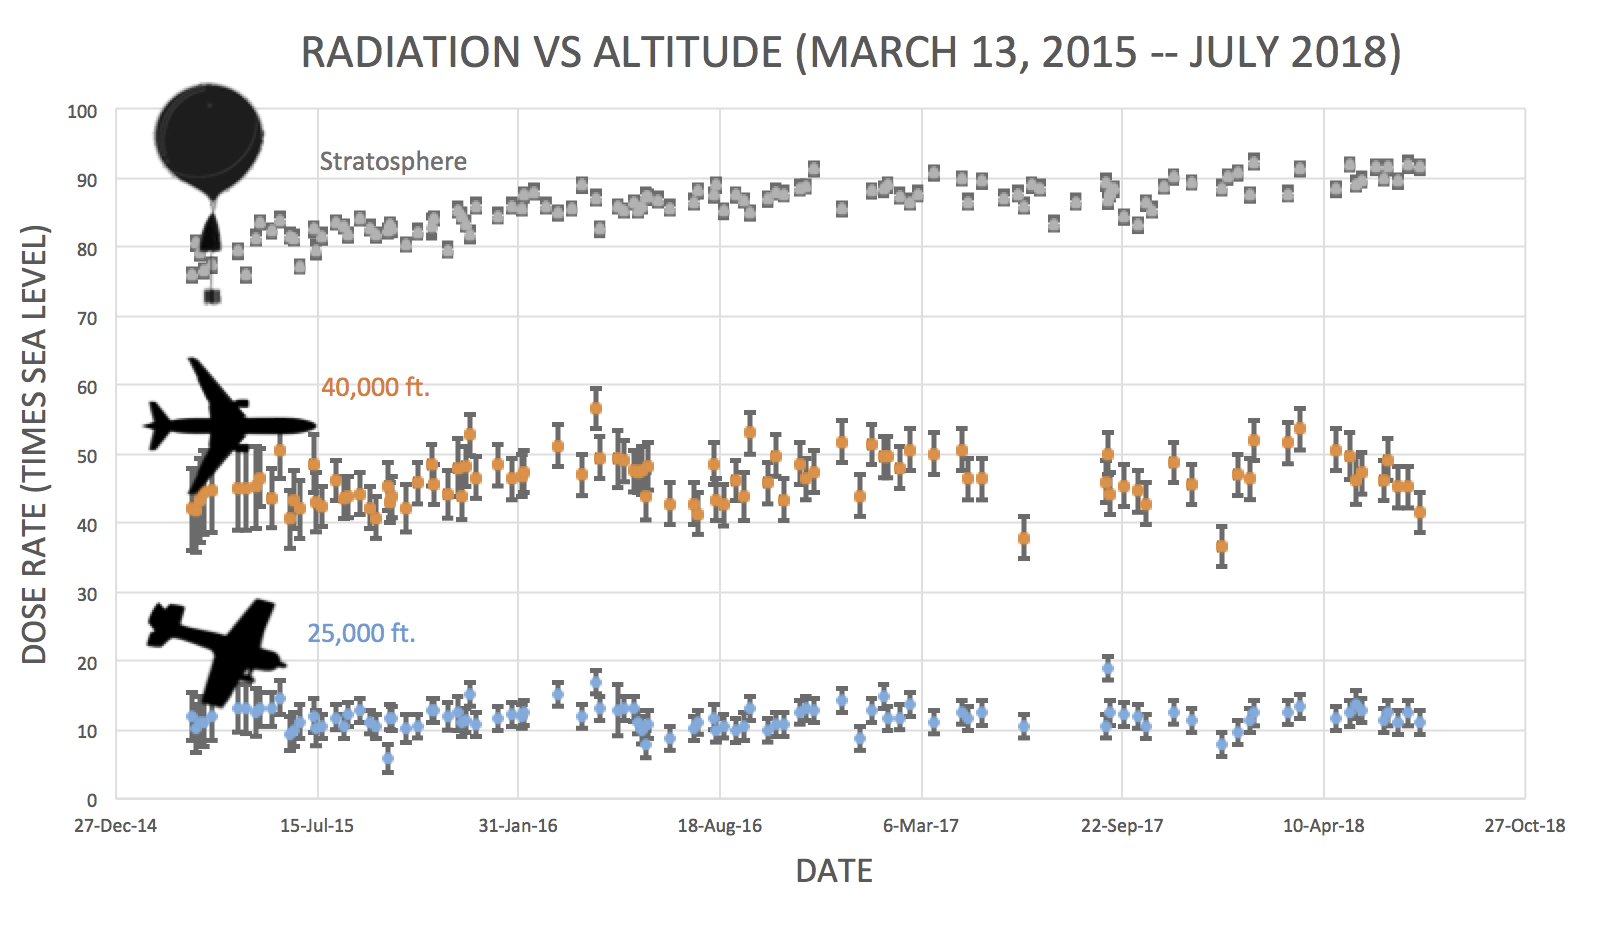
En route to the stratosphere, our sensors also pass through aviation altitudes:
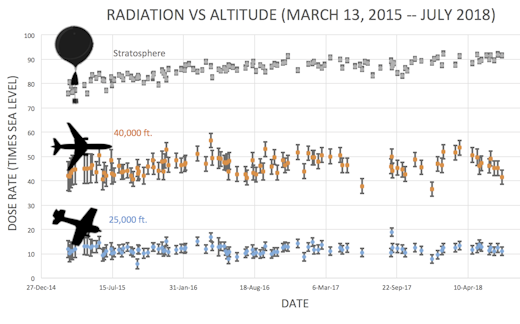
In this plot, dose rates are expessed as multiples of sea level. For instance, we see that boarding a plane that flies at 25,000 feet exposes passengers to dose rates ~10x higher than sea level. At 40,000 feet, the multiplier is closer to 50x.
The radiation sensors onboard our helium balloons detect X-rays and gamma-rays in the energy range 10 keV to 20 MeV. These energies span the range of medical X-ray machines and airport security scanners.
Why are cosmic rays intensifying? The main reason is the sun. Solar storm clouds such as coronal mass ejections (CMEs) sweep aside cosmic rays when they pass by Earth. During Solar Maximum, CMEs are abundant and cosmic rays are held at bay. Now, however, the solar cycle is swinging toward Solar Minimum, allowing cosmic rays to return. Another reason could be the weakening of Earth's magnetic field, which helps protect us from deep-space radiation.
| | The official U.S. government space weather bureau |
| | The first place to look for information about sundogs, pillars, rainbows and related phenomena. |
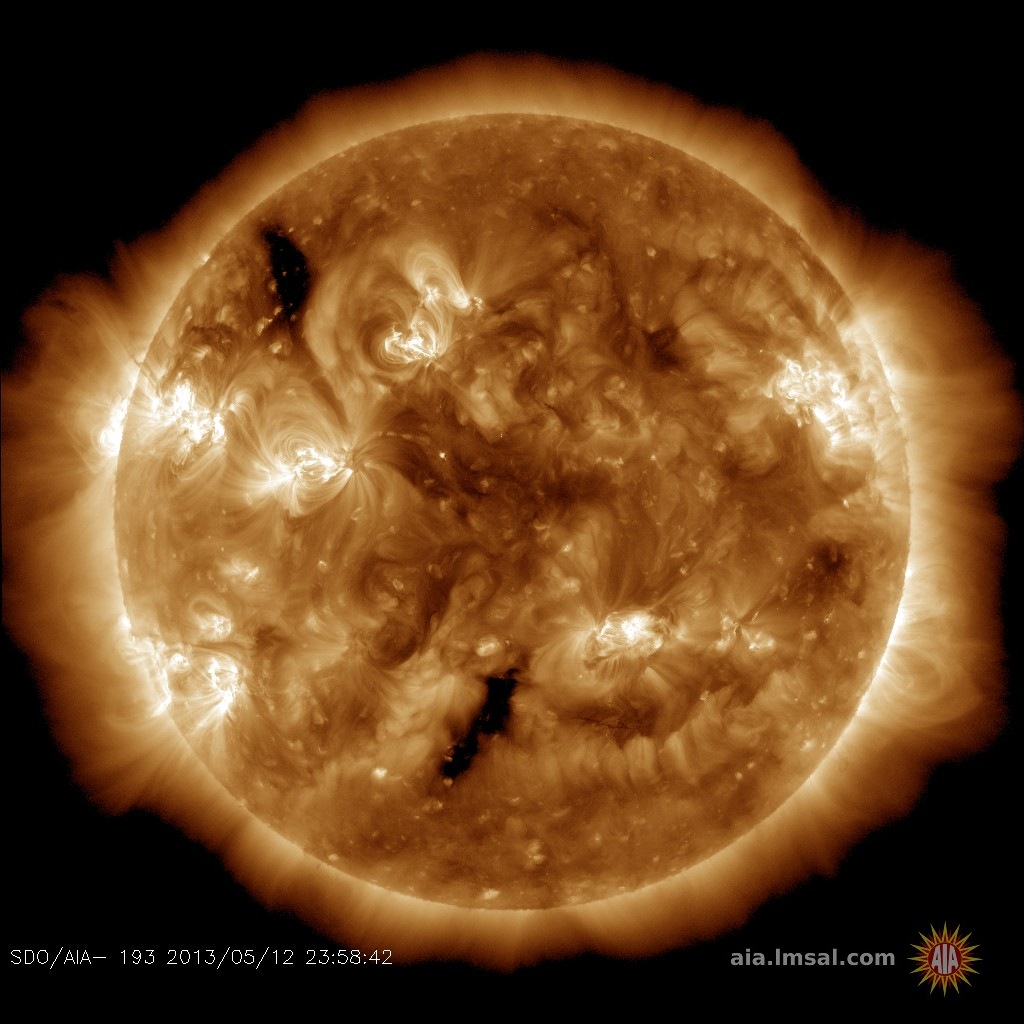
| | Researchers call it a "Hubble for the sun." SDO is the most advanced solar observatory ever. |
| | 3D views of the sun from NASA's Solar and Terrestrial Relations Observatory |
| | Realtime and archival images of the Sun from SOHO. |
| | from the NOAA Space Environment Center |
| | fun to read, but should be taken with a grain of salt! Forecasts looking ahead more than a few days are often wrong. |
| | from the NOAA Space Environment Center |
| | the underlying science of space weather |
 | To find reviews of new online casino sites in the UK try The Casino DB where there are hundreds of online casino reviews complete with bonuses and ratings. Looking for a new online casino? Try Casimpo the new site dedicated to making online casino simple and easy for all. |
| | These links help Spaceweather.com stay online. Thank you to our supporters! |
| | | | | | |


