| Asteroid | Date(UT) | Miss Distance | Velocity (km/s) | Diameter (m) |
| 2018 FR1 | 2018-Mar-26 | 6.2 LD | 12.2 | 17 |
| 2018 DH1 | 2018-Mar-27 | 9.2 LD | 14.4 | 224 |
| 2016 SR2 | 2018-Mar-28 | 18.7 LD | 7.3 | 20 |
| 2018 FU1 | 2018-Mar-28 | 12.3 LD | 5.9 | 15 |
| 2018 FO4 | 2018-Mar-28 | 7.7 LD | 6.3 | 11 |
| 2018 FU3 | 2018-Mar-29 | 17.7 LD | 8.4 | 20 |
| 2018 FE4 | 2018-Mar-29 | 13.3 LD | 20.7 | 40 |
| 2018 FB | 2018-Mar-29 | 4.9 LD | 8.5 | 55 |
| 2018 FB2 | 2018-Mar-30 | 10 LD | 6.7 | 26 |
| 2018 FK5 | 2018-Mar-30 | 0.4 LD | 11.5 | 8 |
| 2010 GD35 | 2018-Mar-31 | 15.5 LD | 11.6 | 45 |
| 2018 EM4 | 2018-Apr-01 | 6.3 LD | 6.2 | 31 |
| 2004 FG29 | 2018-Apr-02 | 4 LD | 14.9 | 22 |
| 2018 ER1 | 2018-Apr-02 | 15.6 LD | 4 | 26 |
| 2018 EB | 2018-Apr-04 | 10.4 LD | 15.1 | 165 |
| 2018 FW4 | 2018-Apr-05 | 9.8 LD | 11.6 | 35 |
| 363599 | 2018-Apr-12 | 19.3 LD | 24.5 | 224 |
| 2014 UR | 2018-Apr-14 | 9.3 LD | 4.4 | 17 |
| 2016 JP | 2018-Apr-20 | 12 LD | 12.7 | 214 |
| 2012 XL16 | 2018-Apr-23 | 15.8 LD | 6.1 | 28 |
| 2013 US3 | 2018-Apr-29 | 10.1 LD | 7.7 | 214 |
| 2018 FV4 | 2018-Apr-29 | 17.7 LD | 6.5 | 61 |
| 2002 JR100 | 2018-Apr-29 | 10.8 LD | 7.7 | 49 |
| 1999 FN19 | 2018-May-07 | 9.7 LD | 5.7 | 118 |
| 2016 JQ5 | 2018-May-08 | 6.3 LD | 10.4 | 9 |
| 388945 | 2018-May-09 | 6.5 LD | 9 | 295 |
| 1999 LK1 | 2018-May-15 | 13.3 LD | 10 | 141 |
| 68347 | 2018-May-29 | 9.5 LD | 13.3 | 389 |
Notes: LD means "Lunar Distance." 1 LD = 384,401 km, the distance between Earth and the Moon. 1 LD also equals 0.00256 AU. MAG is the visual magnitude of the asteroid on the date of closest approach. | | Cosmic Rays in the Atmosphere |
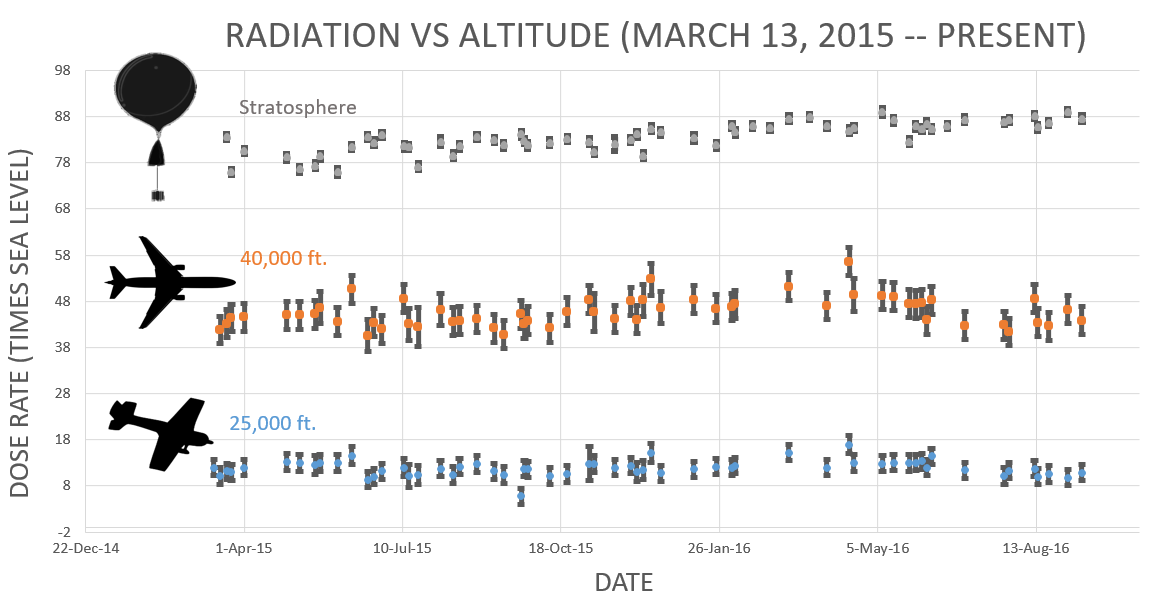
Readers, thank you for your patience while we continue to develop this new section of Spaceweather.com. We've been working to streamline our data reduction, allowing us to post results from balloon flights much more rapidly, and we have developed a new data product, shown here:
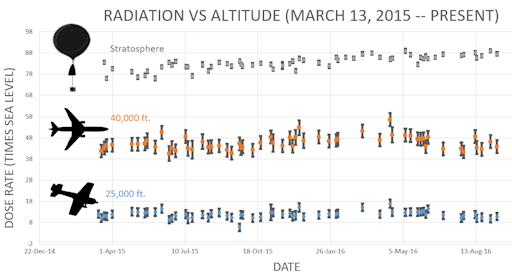
This plot displays radiation measurements not only in the stratosphere, but also at aviation altitudes. Dose rates are expessed as multiples of sea level. For instance, we see that boarding a plane that flies at 25,000 feet exposes passengers to dose rates ~10x higher than sea level. At 40,000 feet, the multiplier is closer to 50x. These measurements are made by our usual cosmic ray payload as it passes through aviation altitudes en route to the stratosphere over California.
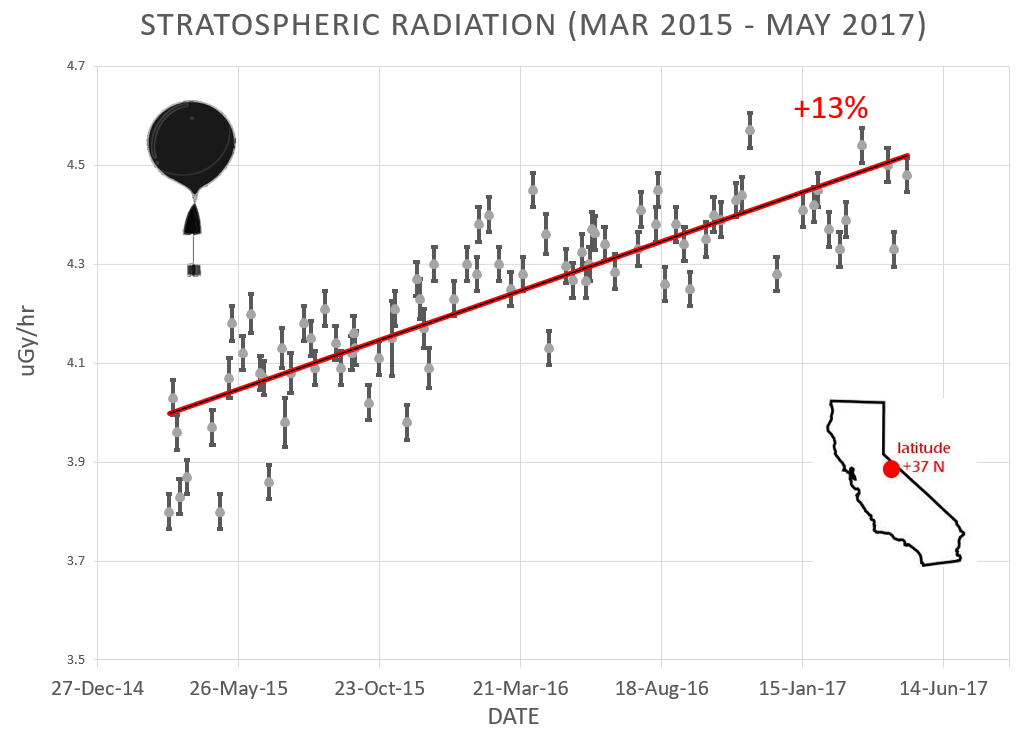
What is this all about? Approximately once a week, Spaceweather.com and the students of Earth to Sky Calculus fly space weather balloons to the stratosphere over California. These balloons are equipped with radiation sensors that detect cosmic rays, a surprisingly "down to Earth" form of space weather. Cosmic rays can seed clouds, trigger lightning, and penetrate commercial airplanes. Furthermore, there are studies ( #1, #2, #3, #4) linking cosmic rays with cardiac arrhythmias and sudden cardiac death in the general population. Our latest measurements show that cosmic rays are intensifying, with an increase of more than 13% since 2015:
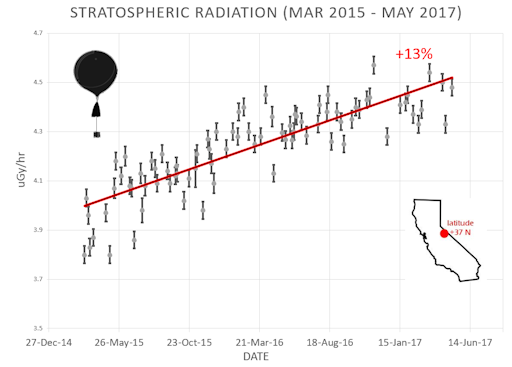
Why are cosmic rays intensifying? The main reason is the sun. Solar storm clouds such as coronal mass ejections (CMEs) sweep aside cosmic rays when they pass by Earth. During Solar Maximum, CMEs are abundant and cosmic rays are held at bay. Now, however, the solar cycle is swinging toward Solar Minimum, allowing cosmic rays to return. Another reason could be the weakening of Earth's magnetic field, which helps protect us from deep-space radiation.
The radiation sensors onboard our helium balloons detect X-rays and gamma-rays in the energy range 10 keV to 20 MeV. These energies span the range of medical X-ray machines and airport security scanners.
The data points in the graph above correspond to the peak of the Reneger-Pfotzer maximum, which lies about 67,000 feet above central California. When cosmic rays crash into Earth's atmosphere, they produce a spray of secondary particles that is most intense at the entrance to the stratosphere. Physicists Eric Reneger and Georg Pfotzer discovered the maximum using balloons in the 1930s and it is what we are measuring today.
| | The official U.S. government space weather bureau |
| | The first place to look for information about sundogs, pillars, rainbows and related phenomena. |
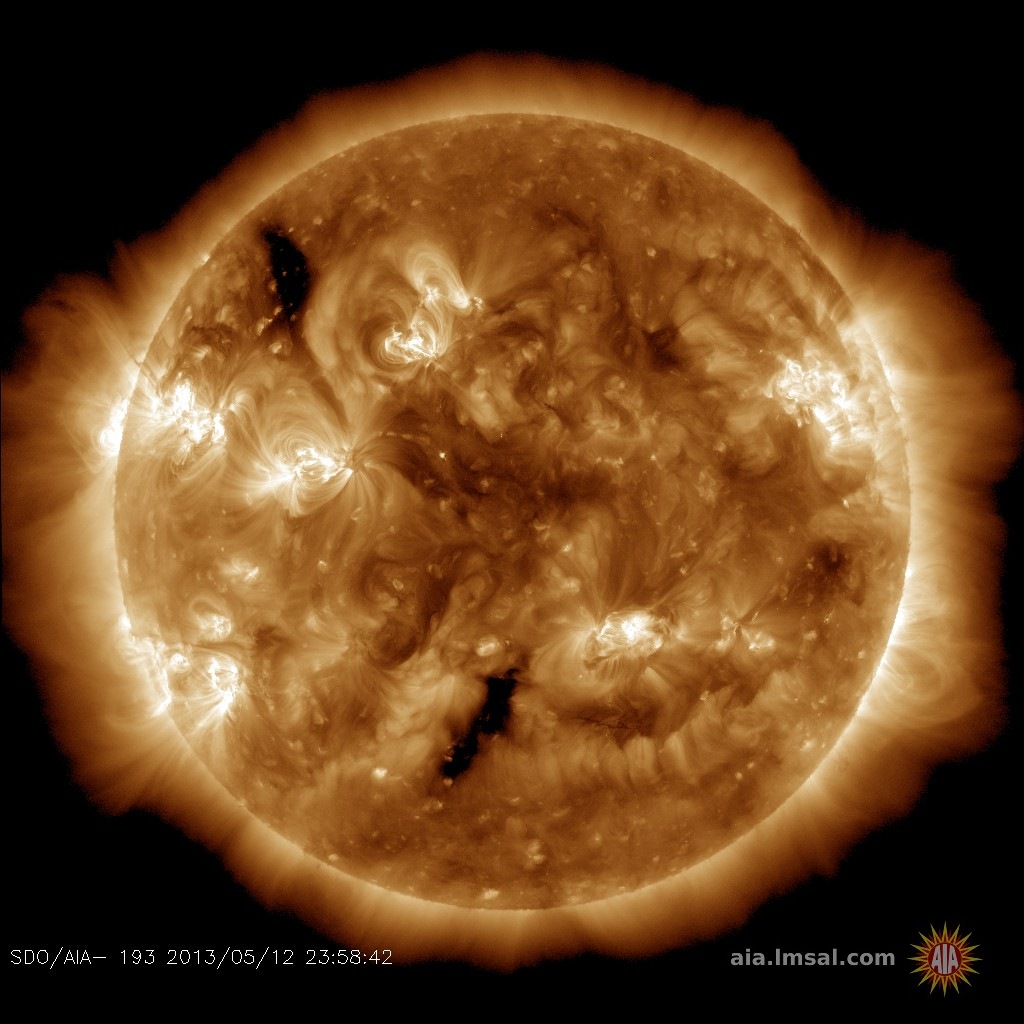
| | Researchers call it a "Hubble for the sun." SDO is the most advanced solar observatory ever. |
| | 3D views of the sun from NASA's Solar and Terrestrial Relations Observatory |
| | Realtime and archival images of the Sun from SOHO. |
| | from the NOAA Space Environment Center |
| | fun to read, but should be taken with a grain of salt! Forecasts looking ahead more than a few days are often wrong. |
| | from the NOAA Space Environment Center |
| | the underlying science of space weather |
 | Reviews here can help you to pick up best memory foam mattresses. |
| | These links help Spaceweather.com stay online. Thank you to our supporters! |
| | | | | | |


