Come to Tromsø and share Marianne's passion for rural photography: Chasethelighttours.co.uk invites you to experience "Heaven on Earth" with an aurora, fjord, fishing, whale watching, photography or sightseeing tour. | | |
BLUE MOON AURORAS? NOAA forecasters estimate a 60% chance of polar geomagnetic storms on July 31st when a co-rotating interaction region (CIR) is expected to hit Earth's magnetic field. CIRs are transition zones between fast- and slow-moving solar wind streams. Solar wind plasma piles up in these regions, producing density gradients and shock waves that do a good job of sparking auroras. Any display will need to pierce the glare of Friday's Blue Moon. Aurora alerts: text or voice.
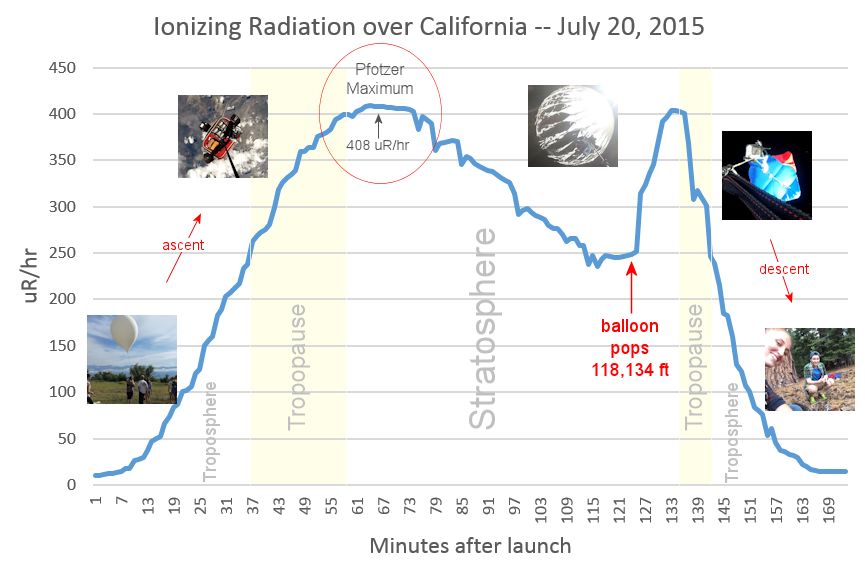
COSMIC RAYS IN THE ATMOSPHERE: At the entrance to the stratosphere, about 70,000 feet above Earth's surface, there is a broad layer of ionizing radiation called the "Pfotzer Maximum." Many airplanes fly just below it; satellites orbit high above it. The best way to penetrate this layer, and to study it, is using high-altitude balloons. Since Oct. 2013, Spaceweather.com and the students of Earth to Sky Calculus have been flying balloons into the Pfotzer Maximum to monitor its response to solar storms. Here is an example of data taken just last week:
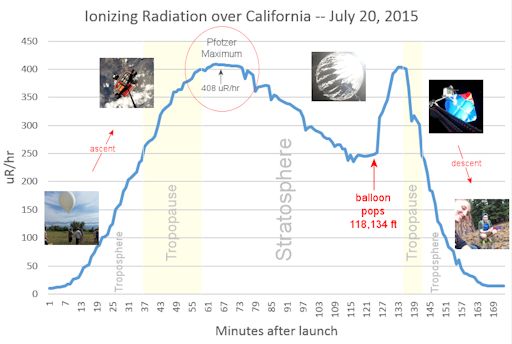
Above: X-ray/gamma-ray dose rates in the energy range 10 keV to 20 Mev
The blue curve traces the increase in radiation as the balloon ascends toward the stratosphere. At the Pfotzer maximum, radiation levels are more than 100x higher than on the ground below. Monitoring this peak is important for many reasons. For example, radiation from the Pfotzer Maximum can leak down to aviation altitudes, affecting air travelers. It can also alter the chemistry of the upper atmosphere.
During two years of monitoring, the students have seen the Pfotzer Maximum surge and subside in response to several solar storms. All of the data were collected high above the Sierra Nevada mountains of central California. This raises a question: What happens to the Pfotzer Maximum in other places?
To find out, on July 20th the team launched two balloons, simultaneously, 2947 miles apart. Identical radiation sensors were flown to the stratosphere above California (+37 N latitude) and New Hampshire (+43 N). Despite the relatively small difference in geographic latitude between the two launch sites, there was a significant difference in the intensity of the Pfotzer Maximum. This graphic overlays data from the cross-country flights:
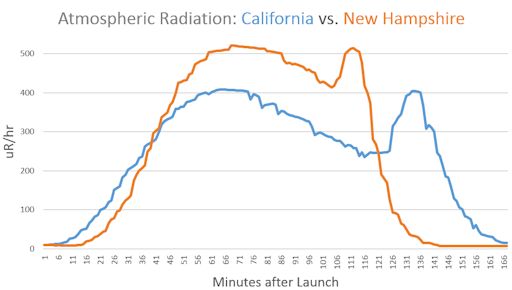
The two balloons were in flight for different amounts of time--almost 3 hours over California vs. little more than 2 hours over New Hampshire. That's why the curves appear to be stretched differently in the horizontal direction. Ignore that. Instead, pay attention to the amplitude of the curves: The stratosphere over New Hampshire was 25% more "radioactive" than the stratosphere over California.
This shows that balloon flights over a single location can be informative, but they do not tell the full story. To learn more, we are planning additional cross-country flights in the months ahead. Stay tuned!
What is the Pfotzer Maximum? When cosmic rays crash into Earth's atmosphere, they produce a spray of secondary particles. With increasing depth in the atmosphere, the primary cosmic radiation component decreases, whereas the secondary radiation component increases. This complex situation results in a maximum of the dose rate at an altitude of ~20 km, the so-called "Pfotzer maximum," named after physicist Georg Pfotzer who co-discovered the peak using balloons and Geiger tubes in the 1930s.
DAYTIME PLANETS: Usually, astronomers wait until the sun sets to start taking pictures of the heavens. On July 28th in Malaysia, astrophotographer Shahrin Ahmad showed that darkness is not required. "I photographed four planets in broad daylight," he says. Here they are bracketed by the sun and Moon:
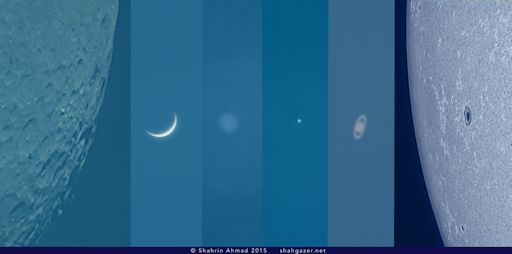
From left to right are crescent-shaped Venus, Jupiter, Mercury, and ringed Saturn. "We were blessed with a good clean sky over Sri Damansara," says Ahmad. "Mercury was surprisingly easy to spot, despite the fact that it was located about 5º from the Sun."
This kind of daytime astronomy is made possible, in part, by modern GOTO telescopes. Once the computerized telescope is aligned on the sky, it can find planets and other objects at any time of day. Some targets, like Venus, are arguably more beautiful when surrounded by daytime blue than nighttime black. Look for more daytime shots scattered throughout the Realtime Photo Gallery:
Realtime Space Weather Photo Gallery
Realtime Aurora Photo Gallery
Realtime Sprite Photo Gallery
Realtime NLC Photo Gallery
Every night, a network of NASA all-sky cameras scans the skies above the United States for meteoritic fireballs. Automated software maintained by NASA's Meteoroid Environment Office calculates their orbits, velocity, penetration depth in Earth's atmosphere and many other characteristics. Daily results are presented here on Spaceweather.com.
On Jul. 30, 2015, the network reported 43 fireballs.
(27 sporadics, 9 alpha Capricornids, 5 Southern delta Aquariids, 2 Perseids)
In this diagram of the inner solar system, all of the fireball orbits intersect at a single point--Earth. The orbits are color-coded by velocity, from slow (red) to fast (blue). [Larger image] [movies]
Potentially Hazardous Asteroids (
PHAs) are space rocks larger than approximately 100m that can come closer to Earth than 0.05 AU. None of the known PHAs is on a collision course with our planet, although astronomers are finding
new ones all the time.
On July 30, 2015 there were potentially hazardous asteroids.
Recent & Upcoming Earth-asteroid encounters: | Asteroid | Date(UT) | Miss Distance | Size |
| 1999 JD6 | Jul 25 | 18.8 LD | 1.6 km |
| 2005 NZ6 | Aug 6 | 76.5 LD | 1.4 km |
| 2005 JF21 | Aug 16 | 20.1 LD | 1.6 km |
| 2004 BO41 | Aug 31 | 57.3 LD | 1.2 km |
| 1991 CS | Sep 4 | 62.1 LD | 1.4 km |
| 2014 KS76 | Sep 14 | 8.7 LD | 22 m |
| 2004 TR12 | Sep 15 | 58.8 LD | 1.0 km |
Notes: LD means "Lunar Distance." 1 LD = 384,401 km, the distance between Earth and the Moon. 1 LD also equals 0.00256 AU. MAG is the visual magnitude of the asteroid on the date of closest approach. | | The official U.S. government space weather bureau |
| | The first place to look for information about sundogs, pillars, rainbows and related phenomena. |
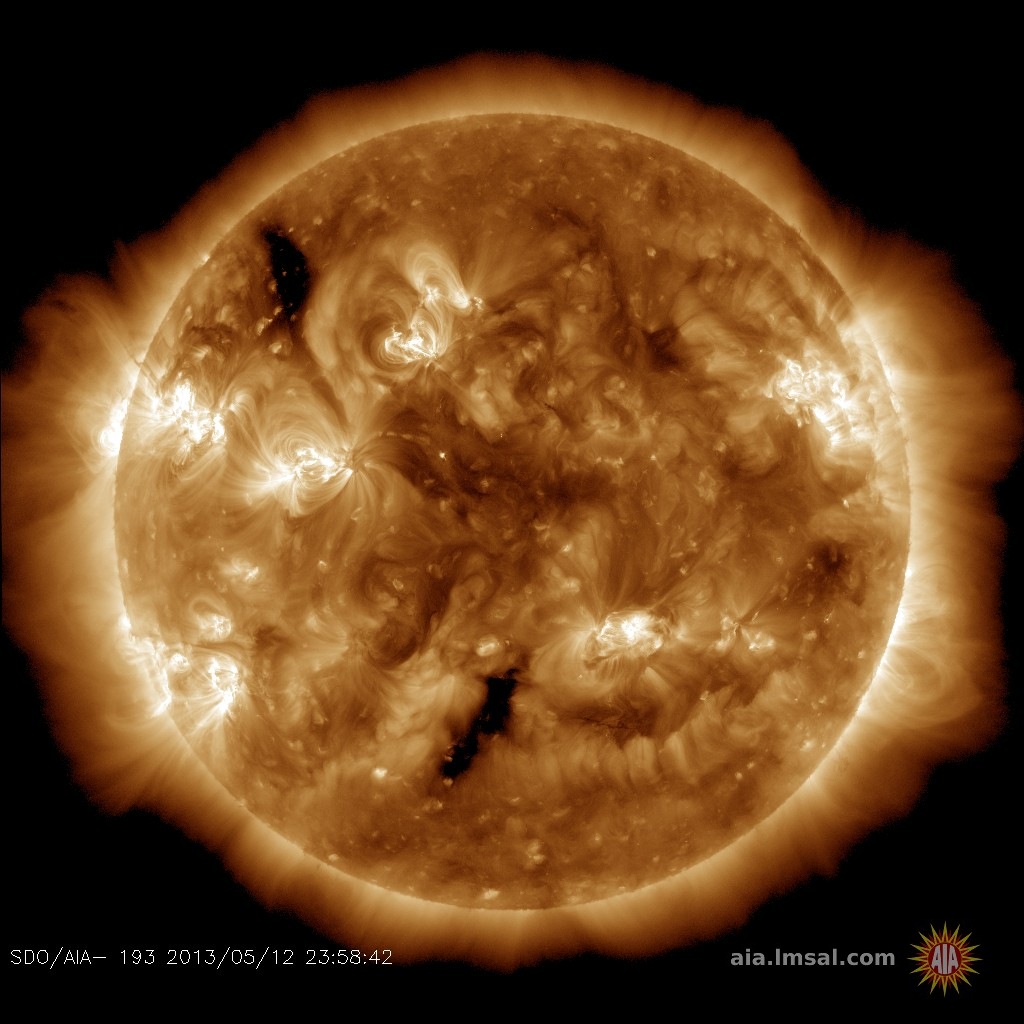
| | Researchers call it a "Hubble for the sun." SDO is the most advanced solar observatory ever. |
| | 3D views of the sun from NASA's Solar and Terrestrial Relations Observatory |
| | Realtime and archival images of the Sun from SOHO. |
| | from the NOAA Space Environment Center |
| | the underlying science of space weather |
| | Web-based high school science course with free enrollment |


