Marianne's Arctic Xpress wishes you a Happy New Year. Learn to photograph auroras with the experts. Full photography tuition, all clothing, and semi-pro camera equipment included. Groups of 2 to 8 welcome. Book Now | | | EXITING THE SOLAR WIND STREAM: After six days inside, Earth is finally beginning to exit a broad stream of solar wind blowing from a large hole in the sun's atmosphere. Arctic sky watchers should remain alert for auroras, however, because wind speeds are still above 500 km/s. Free: Aurora Alerts. I'M DREAMING OF A ... PINK CHRISTMAS? Christmas Day 2016 brought a fantastic display of auroras to the Arctic Circle. A great many of them were pink. James Helmericks sends this picture from the Colville River Delta in northern Alaska: 
"This was the brightest pink display I have ever seen, at one time even giving the snow a pink tinge," he says. The pink color is probably a sign of nitrogen. Most auroras are green--a verdant glow caused by energetic particles from space hitting oxygen atoms 100 km to 300 km above Earth's surface. Seldom-seen pink appears when the energetic particles descend lower than usual, striking nitrogen molecules at the 100 km level and below. On the days and nights around Christmas 2016, the pinks became so intense, they appeared white, not only to cameras, "but also to the naked eye," says Sarah Skinner, who witnessed the strange colors several nights in a row from Abisko, Sweden. "It looked like someone had photoshopped the sky!" she says. It is worth noting that these remarkable auroras appeared during a lull in solar activity. For three days centered on Christmas, the face of the sun was completely blank. There were no sunspots, no solar flares, and no CMEs. Instead, the display was caused by a high-speed solar wind stream blowing out of a large hole in the sun's atmosphere. Such atmospheric holes are common during Solar Minimum, so we can expect many similar displays as the sunspot cycle crashes in the years ahead. Realtime Aurora Photo Gallery IRIDESCENT CLOUDS OVER FRANCE: To see fantastic colors in the sky, it is not always necessary to travel to the Arctic Circle. Today, Dec. 27th, Antoine Gerhardt photographed this display over Serres, France: 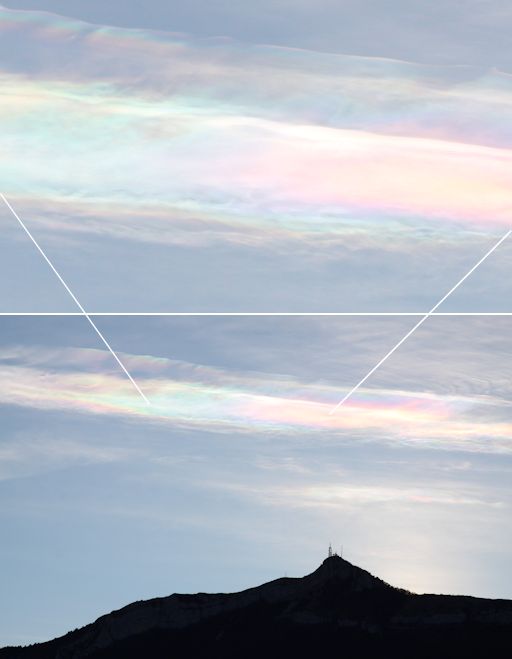
"Such beautiful colors in the southern French sky," says Gerhardt. These are iridescent clouds, colored by sunlight shining through tiny droplets of water. Many clouds contain water droplets, but only a few exhibit this kind of splendid iridescence. For such vivid pastel colors to appear, all of the droplets in the cloud must be of a uniform small size. Only then can the physics of diffraction work its color-creating magic. Realtime Space Weather Photo Gallery EVOLUTION OF A CORONAL HOLE: Christmas 2016 was special for sky watchers around the Arctic Circle. The skies were filled with some of the best and most colorful Northern Lights of the year. The source of the display: A giant "coronal hole" in the sun's atmosphere sprayed our planet with solar wind. The hole opened up in July 2016 and it has been strobing Earth with solar wind every ~28 days ever since as the hole spins around with the slowly turning sun. Spaceweather.com reader Stuart Green has prepared a plot showing the evolution of the coronal hole and the effect it has had on the magnetic field at his private observatory in Preston, England. Click on the image to inspect the full 6 months: 
Inset images come from NASA's Solar Dynamics Observatory. The coronal hole is the giant dark region, starting small in July, then growing and shape-shifting as the year unfolds.
The background strip chart recording shows the instability of the magnetic field around Green's private observatory. When the coronal hole is facing Earth, big changes are measured.
"I've been recording geomagnetic activity over the past three years using a home built/ home designed magnetometer," says Green. "The sensor is buried in my garden about 0.5m below the surface in an East/West orientation to allow very sensitive (sub nanotesla) measurements of magnetic declination occurring during geomagnetic storms. The plots show the change in magnetic flux density in nanotesla occurring between readings, which are taken automatically using logging software every 2.5 minutes." Green's presentation suggests that this yawning hole is a long-lived feature on the sun, and it will probably be back as potent as ever 28 days from now. Stay tuned for magnetic unrest--and more Arctic auroras--in January.
Realtime Airglow Photo Gallery
Realtime Sprite Photo Gallery Every night, a network of NASA all-sky cameras scans the skies above the United States for meteoritic fireballs. Automated software maintained by NASA's Meteoroid Environment Office calculates their orbits, velocity, penetration depth in Earth's atmosphere and many other characteristics. Daily results are presented here on Spaceweather.com. On Dec. 27, 2016, the network reported 11 fireballs.
(9 sporadics, 2 December Leonis Minorids)  In this diagram of the inner solar system, all of the fireball orbits intersect at a single point--Earth. The orbits are color-coded by velocity, from slow (red) to fast (blue). [Larger image] [movies] Potentially Hazardous Asteroids ( PHAs) are space rocks larger than approximately 100m that can come closer to Earth than 0.05 AU. None of the known PHAs is on a collision course with our planet, although astronomers are finding new ones all the time. On December 27, 2016 there were potentially hazardous asteroids. Notes: LD means "Lunar Distance." 1 LD = 384,401 km, the distance between Earth and the Moon. 1 LD also equals 0.00256 AU. MAG is the visual magnitude of the asteroid on the date of closest approach. | | Cosmic Rays in the Atmosphere |
Readers, thank you for your patience while we continue to develop this new section of Spaceweather.com. We've been working to streamline our data reduction, allowing us to post results from balloon flights much more rapidly, and we have developed a new data product, shown here: 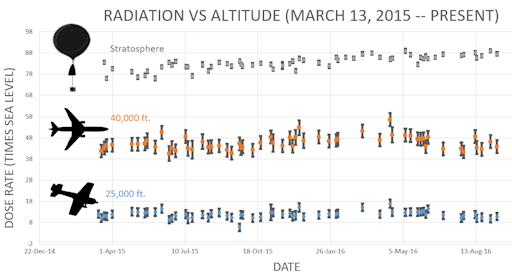
This plot displays radiation measurements not only in the stratosphere, but also at aviation altitudes. Dose rates are expessed as multiples of sea level. For instance, we see that boarding a plane that flies at 25,000 feet exposes passengers to dose rates ~10x higher than sea level. At 40,000 feet, the multiplier is closer to 50x. These measurements are made by our usual cosmic ray payload as it passes through aviation altitudes en route to the stratosphere over California. What is this all about? Approximately once a week, Spaceweather.com and the students of Earth to Sky Calculus fly space weather balloons to the stratosphere over California. These balloons are equipped with radiation sensors that detect cosmic rays, a surprisingly "down to Earth" form of space weather. Cosmic rays can seed clouds, trigger lightning, and penetrate commercial airplanes. Furthermore, there are studies ( #1, #2, #3, #4) linking cosmic rays with cardiac arrhythmias and sudden cardiac death in the general population. Our latest measurements show that cosmic rays are intensifying, with an increase of more than 12% since 2015: 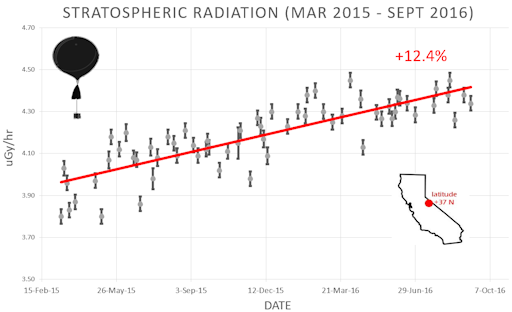
Why are cosmic rays intensifying? The main reason is the sun. Solar storm clouds such as coronal mass ejections (CMEs) sweep aside cosmic rays when they pass by Earth. During Solar Maximum, CMEs are abundant and cosmic rays are held at bay. Now, however, the solar cycle is swinging toward Solar Minimum, allowing cosmic rays to return. Another reason could be the weakening of Earth's magnetic field, which helps protect us from deep-space radiation. The radiation sensors onboard our helium balloons detect X-rays and gamma-rays in the energy range 10 keV to 20 MeV. These energies span the range of medical X-ray machines and airport security scanners. The data points in the graph above correspond to the peak of the Reneger-Pfotzer maximum, which lies about 67,000 feet above central California. When cosmic rays crash into Earth's atmosphere, they produce a spray of secondary particles that is most intense at the entrance to the stratosphere. Physicists Eric Reneger and Georg Pfotzer discovered the maximum using balloons in the 1930s and it is what we are measuring today. | | The official U.S. government space weather bureau | | | The first place to look for information about sundogs, pillars, rainbows and related phenomena. | | | Researchers call it a "Hubble for the sun." SDO is the most advanced solar observatory ever. | | | 3D views of the sun from NASA's Solar and Terrestrial Relations Observatory | | | Realtime and archival images of the Sun from SOHO. | | | from the NOAA Space Environment Center | | | a proud supporter of science education and Spaceweather.com | | | the underlying science of space weather |  | Beautyz for top beauty products reviews and their buying guides | | | These links help Spaceweather.com stay online. Thank you to our supporters! | | 


