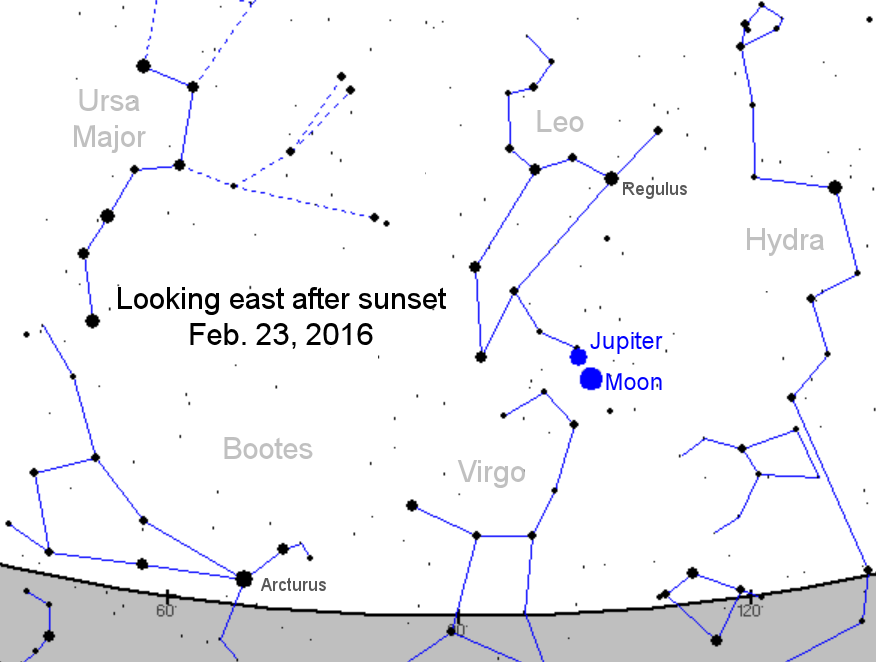
Marianne's Heaven On Earth Aurora Chaser Tours Chasethelighttours.co.uk invites you to join them in their quest to find and photograph the Aurora Borealis. Experience the winter wonderland in the Tromsø Area. | | | THE SNOW MOON: There's a full Moon on Monday night, Feb. 22nd. According to folklore, it has a special name--the "Snow Moon." On average, February is the snowiest month in the USA. Full moonlight reflecting from a snow-covered landscape can make the night very bright, indeed. Bonus: On Tuesday, Feb. 23rd, the waning Snow Moon will be in conjunction with Jupiter--a beautiful close encounter: sky map. AURORA OUTBURST: Earth is slowly exiting a solar wind stream that has sparked bright auroras around the Arctic Circle for the past three days. "On Feb. 17th, the auroras lasted all night long," reports Sacha Layos of Fairbanks, Alaska. This, she says, was the highlight: 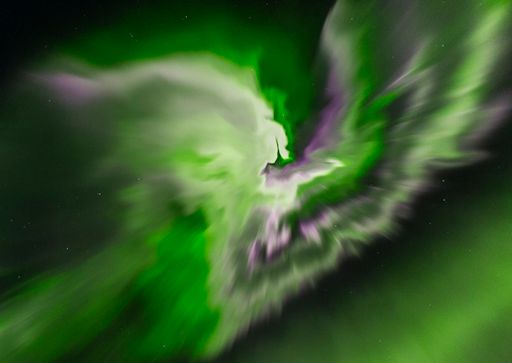
"The outburst lasted less than 4 minutes," says Layos. "It was magnificent." What makes this solar wind stream such a prolific producer of auroras? The answer lies in its magnetic field. Forecasters call it a "negative polarity stream." In other words, the magnetic field of the solar wind tends to point in a direction which opposes Earth's magnetic field: North vs. South. This mismatch opens a crack in our planet's magnetosphere. Solar wind pours in to fuel bright Northern Lights. The odds of auroras are declining as Earth exits the solar wind stream. NOAA forecasters estimate a 50% chance of geomagnetic storms today, declining to 30% on Feb. 20th. Aurora alerts: text or voice Realtime Aurora Photo Gallery RED RAINBOW: Rainbows are normally red, yellow, green and blue--in short, all the colors of a rainbow. But the towering rainbow Jan Koeman photographed from Kloetinge, the Netherlands, on Feb. 18th was simply red: 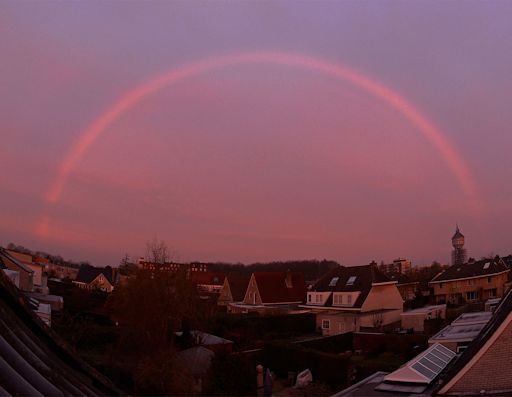
"I have never seen such a rainbow before," says Koeman. "It appeared just a few minutes after a red sunrise." What made the rainbow red? It was only color available. All of the other colors of the rainbow had been scattered away by air molecules and dust particles in front of the low-hanging sun. Koeman notes another puzzle: Rainbows require raindrops, "but it was not raining at all!" he says. Atmospheric optics expert Les Cowley thinks the raindrops were there, in the distance. "There could be rain on the horizon or virga. Virga is cloud precipitation that does not reach the ground," says Cowley. Red rainbows are more common than you might think. They appear with frequency at sunrise or sunset, all around the world. More examples may be found in the realtime photo gallery: Realtime Spaceweather Photo Gallery
Realtime Comet Photo Gallery Every night, a network of NASA all-sky cameras scans the skies above the United States for meteoritic fireballs. Automated software maintained by NASA's Meteoroid Environment Office calculates their orbits, velocity, penetration depth in Earth's atmosphere and many other characteristics. Daily results are presented here on Spaceweather.com. On Feb. 20, 2016, the network reported 2 fireballs.
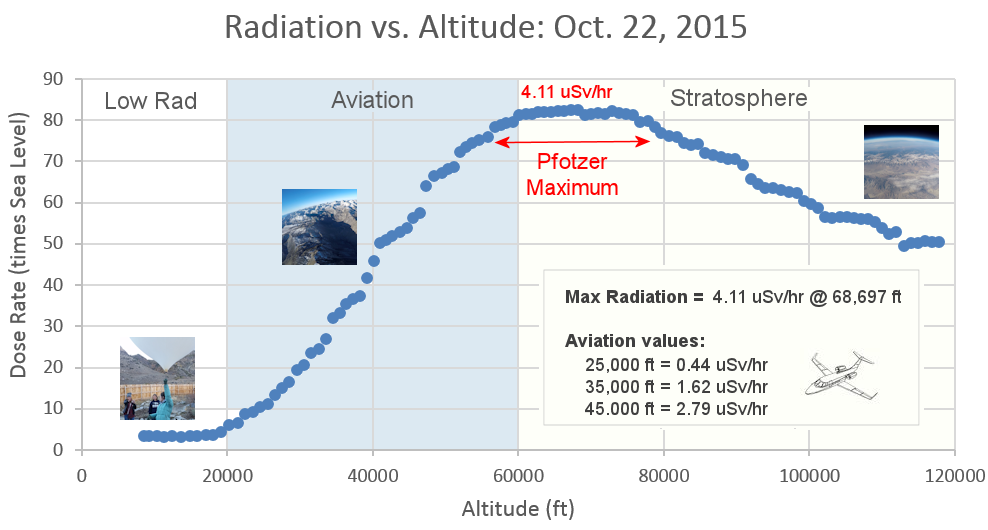
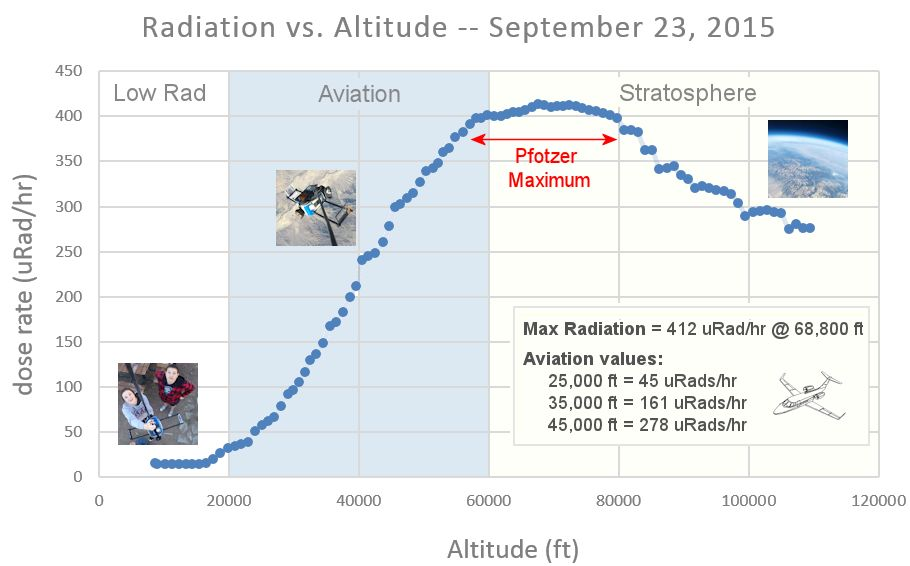
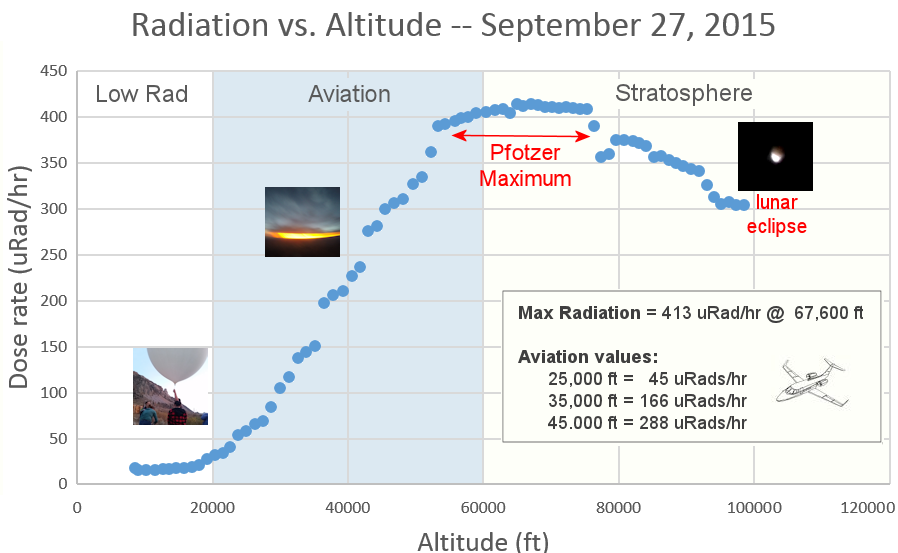
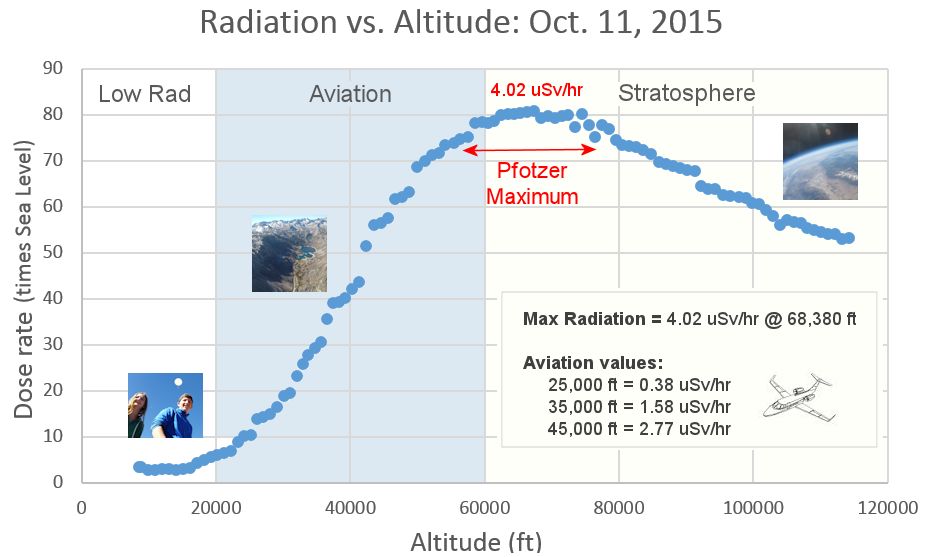
(2 sporadics)  In this diagram of the inner solar system, all of the fireball orbits intersect at a single point--Earth. The orbits are color-coded by velocity, from slow (red) to fast (blue). [Larger image] [movies] Potentially Hazardous Asteroids ( PHAs) are space rocks larger than approximately 100m that can come closer to Earth than 0.05 AU. None of the known PHAs is on a collision course with our planet, although astronomers are finding new ones all the time. On February 20, 2016 there were potentially hazardous asteroids. Notes: LD means "Lunar Distance." 1 LD = 384,401 km, the distance between Earth and the Moon. 1 LD also equals 0.00256 AU. MAG is the visual magnitude of the asteroid on the date of closest approach. | | Cosmic Rays in the Atmosphere | | Situation Report -- Oct. 30, 2015 | Stratospheric Radiation (+37o N) | | Cosmic ray levels are elevated (+6.1% above the Space Age median). The trend is flat. Cosmic ray levels have increased +0% in the past month. | | Sept. 06: 4.14 uSv/hr (414 uRad/hr) | | Sept. 12: 4.09 uSv/hr (409 uRad/hr) | | Sept. 23: 4.12 uSv/hr (412 uRad/hr) | | Sept. 25: 4.16 uSv/hr (416 uRad/hr) | | Sept. 27: 4.13 uSv/hr (413 uRad/hr) | | Oct. 11: 4.02 uSv/hr (402 uRad/hr) | | Oct. 22: 4.11 uSv/hr (411 uRad/hr) | These measurements are based on regular space weather balloon flights: learn more. Approximately once a week, Spaceweather.com and the students of Earth to Sky Calculus fly "space weather balloons" to the stratosphere over California. These balloons are equipped with radiation sensors that detect cosmic rays, a surprisingly "down to Earth" form of space weather. Cosmic rays can seed clouds, trigger lightning, and penetrate commercial airplanes. Our measurements show that someone flying back and forth across the continental USA, just once, can absorb as much ionizing radiation as 2 to 5 dental X-rays. For example, here is the data from a flight on Oct. 22, 2015: 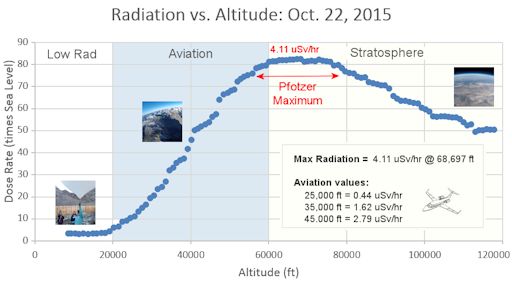
Radiation levels peak at the entrance to the stratosphere in a broad region called the "Pfotzer Maximum." This peak is named after physicist George Pfotzer who discovered it using balloons and Geiger tubes in the 1930s. Radiation levels there are more than 80x sea level. Note that the bottom of the Pfotzer Maximim is near 55,000 ft. This means that some high-flying aircraft are not far from the zone of maximum radiation. Indeed, according to the Oct 22th measurements, a plane flying at 45,000 feet is exposed to 2.79 uSv/hr. At that rate, a passenger would absorb about one dental X-ray's worth of radiation in about 5 hours. The radiation sensors onboard our helium balloons detect X-rays and gamma-rays in the energy range 10 keV to 20 MeV. These energies span the range of medical X-ray machines and airport security scanners. | | The official U.S. government space weather bureau | | | The first place to look for information about sundogs, pillars, rainbows and related phenomena. | | | Researchers call it a "Hubble for the sun." SDO is the most advanced solar observatory ever. | | | 3D views of the sun from NASA's Solar and Terrestrial Relations Observatory | | | Realtime and archival images of the Sun from SOHO. | | | from the NOAA Space Environment Center | | | the underlying science of space weather | | 


