Solar minimum is here - but even now strangely beautiful auroras are dancing around the poles. Deep inside the Arctic Circle, the expert guides of Aurora Holidays in Utsjoki, Finland, can help you chase them. Book now! | | |
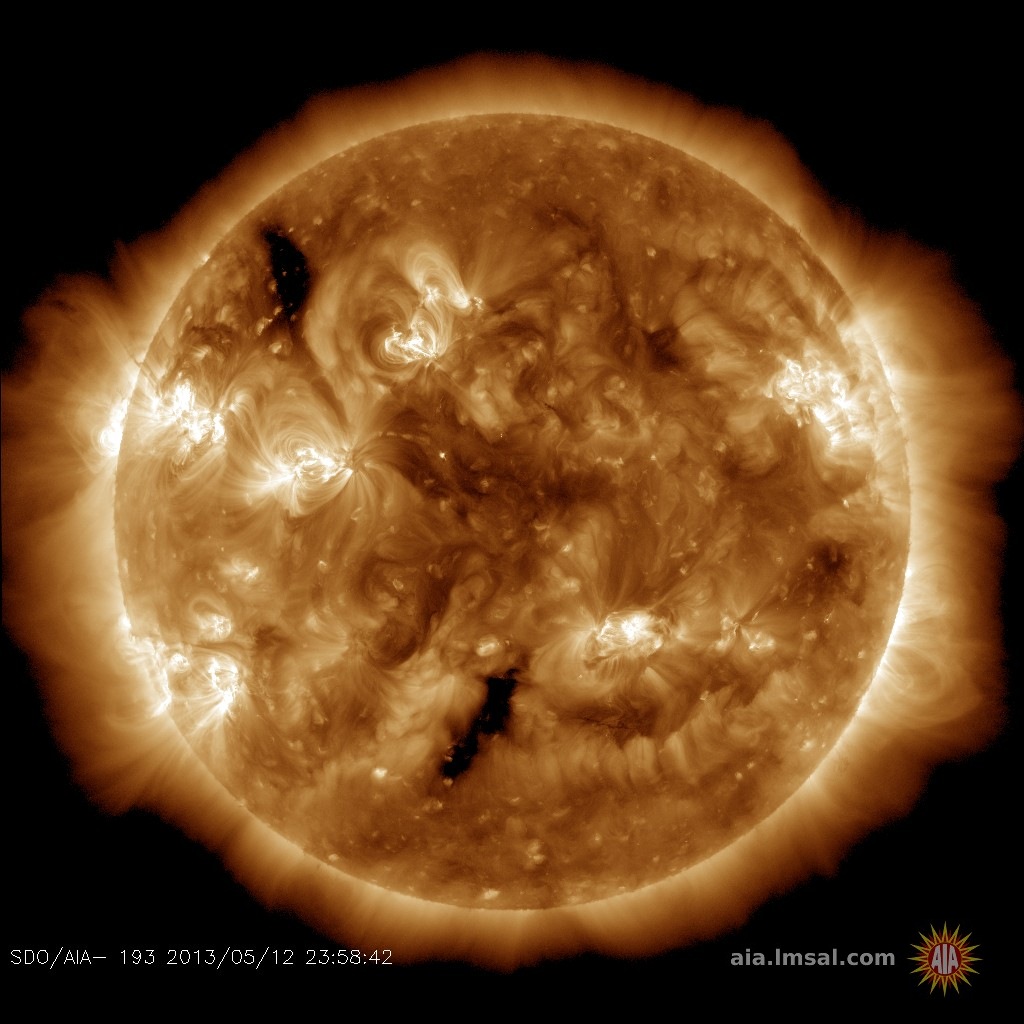
THE SUN LOOKS LIKE A GIANT ORANGE BILLIARD BALL: Today marks the 31st consecutive day that the sun has been without spots. Images of the sun look like a big orange billiard ball--utterly blank. This is a sign of Solar Minimum, a phase of the solar cycle that brings extra cosmic rays, long-lasting holes in the sun's atmosphere, and a possible surplus of noctilucent clouds. Aurora alerts: SMS Text
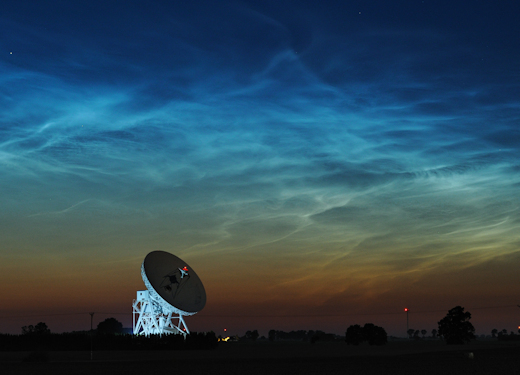
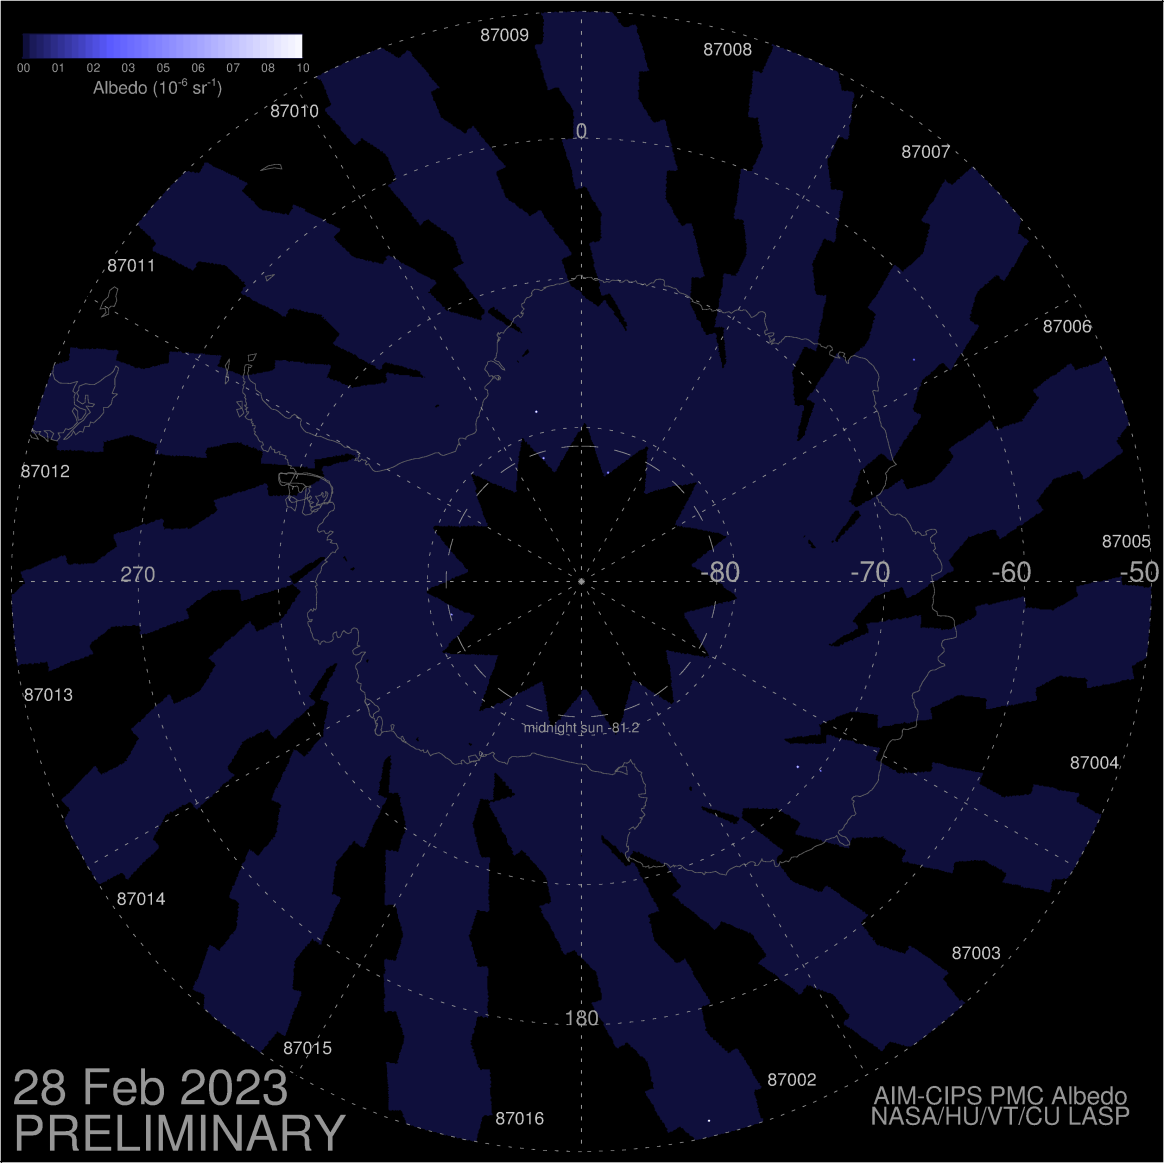
MYSTERIOUS MOISTURE IN THE MESOSPHERE: The 2019 season for noctilucent clouds (NLCs) has been remarkable, maybe the best ever, with NLCs appearing as far south as Los Angeles CA and Albuquerque NM. What's going on? Researchers aren't sure, but Lynn Harvey of the University of Colorado's Laboratory for Atmospheric and Space Physics has just found an important clue.
"The mesosphere is quite wet," she says. "Water vapor concentrations are at their highest levels for the past 12 years."
Noctilucent clouds over Piwnice, Poland, on June 18th. Credit: Piotr Majewski
Noctilucent clouds form when summertime wisps of water vapor rise to the top of the atmosphere. Water molecules stick to specks of meteor smoke, gathering into icy clouds that glow electric blue when they are hit by high altitude sunlight.
When noctilucent clouds began appearing at unusually low latitudes in early June, Harvey took a look at data from NASA's Microwave Limb Sounder--a satellite-based sensor that can measure water in the upper atmosphere. Her results are shown in the animated plot below.
"The red line is 2019, while other colors trace previous years," explains Harvey. "The plot cycles from low to high latitudes," showing a wave of moisture in the mesosphere.
It's a veritable tidal wave. Water vapor concentrations at lower latitudes (35 to 45 N) have nearly doubled their normal values, providing a surplus of H2O molecules for noctilucent clouds. Researchers aren't sure where the water is coming from, though.
"Planetary wave activity could be transporting cold air and high water vapor to the 'noctilucent zone,'" speculates James Russell of Hampton University's Center for Atmospheric Sciences. "We've seen this happen before during mid-latitude outbreaks of noctilucent clouds."
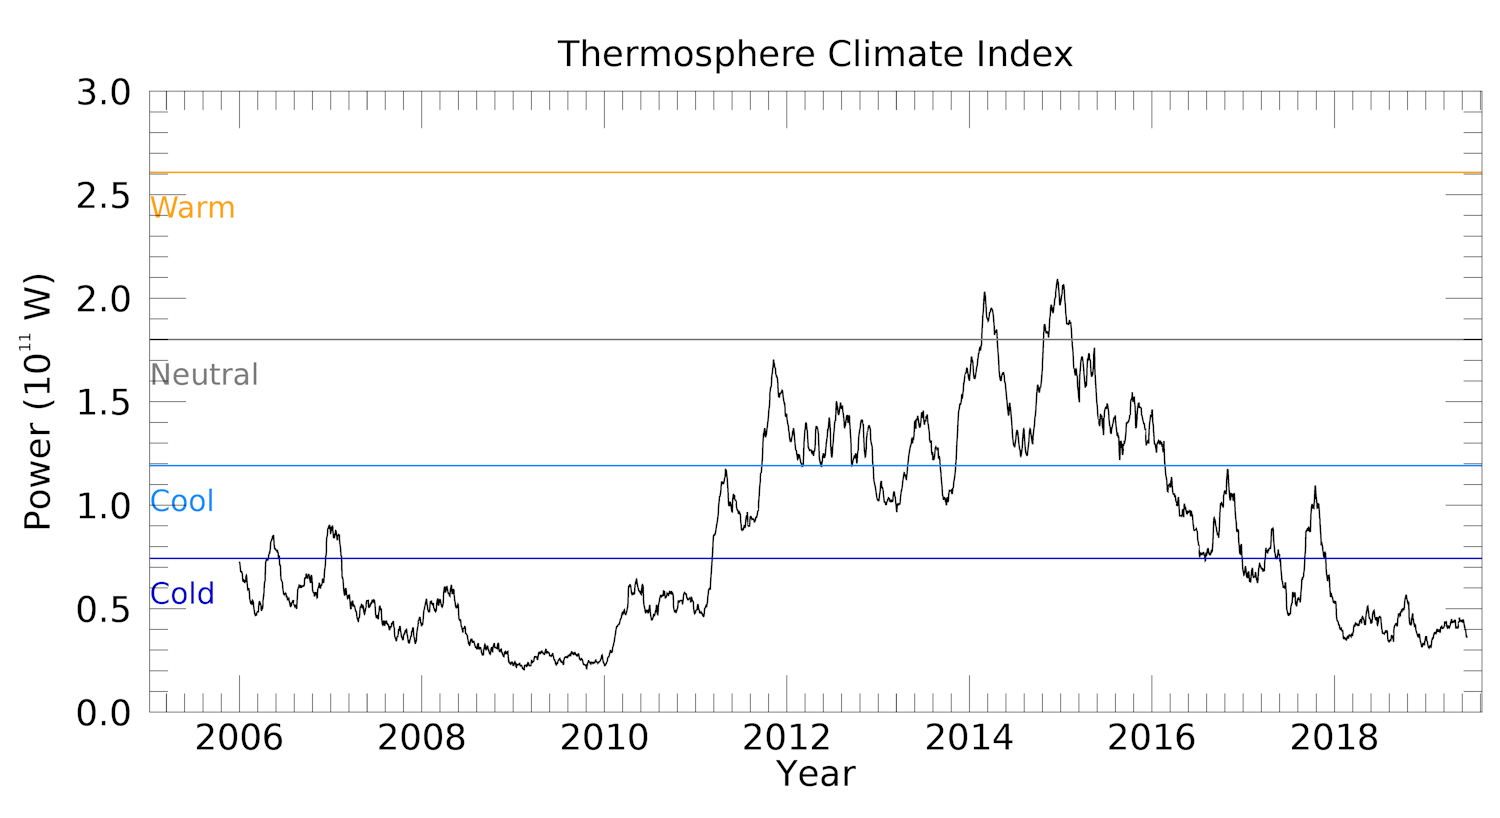
The solar cycle may be helping, too. Right now a deep Solar Minimum is underway. Ultraviolet radiation that would normally destroy water in the mesosphere is at low ebb.
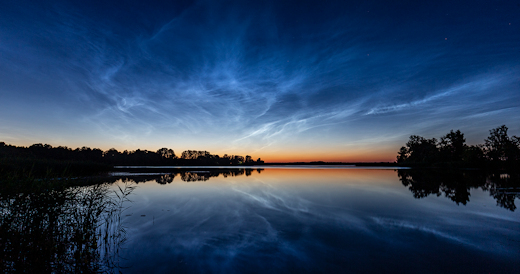
Noctilucent clouds over Riga, Latvia,on June 18th. Credit: Ivo Dinsbergs
The wave appears to be breaking. "As we enter the 3rd week of June, the water has stopped increasing," notes Harvey. "Poleward of 70N the water content has been dropping for a few weeks, and right around the north pole it's getting quite dry. At mid-latitudes (35-65N), water content is still high, but it's leveling off."
No one knows what will happen next. Another wave could bring renewed sightings of NLCs at low latitudes. Or conditions could return to normal, restoring the clouds to their usual habitat near the Arctic Circle. Says Russell, "this all points to mysteries of the atmosphere that have not been solved." Stay tuned!
Realtime Noctilucent Cloud Photo Gallery
Free: Spaceweather.com Newsletter
APOLLO 11 PROOF SILVER DOLLAR: To celebrate the 50th anniversary of the Apollo 11 Moon landing, the United States Mint has created a commemorative 2019 Proof Silver Dollar. We decided to celebrate even more by flying the coins to the edge of space. On June 13th, the students of Earth to Sky Calculus launched this 99.9% silver dollar 99,022 feet above Earth's surface:
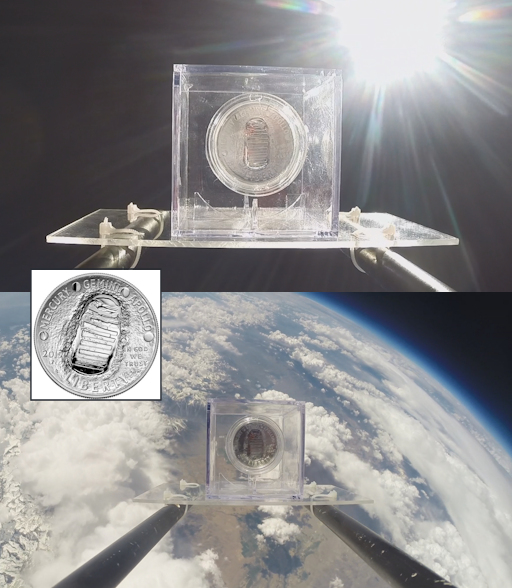
You can have it for $179.95. The students are selling the coins to support their cosmic ray ballooning program. The silver dollar is curved and reproduces the helmet of astronaut Buzz Aldrin. Reflected in Buzz's visor are Neil Armstrong, the United States flag, and the lunar lander. The opposite side of the coin shows Neil's first footprint on the Moon. Each of these coins comes with a greeting card showing the item in flight and a certificate of authenticity.
Far Out Gifts: Earth to Sky Store
All sales support hands-on STEM education
Realtime Aurora Photo Gallery
Free: Spaceweather.com Newsletter
Realtime Space Weather Photo Gallery
Free: Spaceweather.com Newsletter
Every night, a network of
NASA all-sky cameras scans the skies above the United States for meteoritic fireballs. Automated software maintained by NASA's Meteoroid Environment Office calculates their orbits, velocity, penetration depth in Earth's atmosphere and many other characteristics. Daily results are presented here on Spaceweather.com.
On Jun. 19, 2019, the network reported 3 fireballs.
(3 sporadics)
In this diagram of the inner solar system, all of the fireball orbits intersect at a single point--Earth. The orbits are color-coded by velocity, from slow (red) to fast (blue). [Larger image] [movies]
Potentially Hazardous Asteroids (
PHAs) are space rocks larger than approximately 100m that can come closer to Earth than 0.05 AU. None of the known PHAs is on a collision course with our planet, although astronomers are finding
new ones all the time.
On June 19, 2019 there were 1983 potentially hazardous asteroids.
 |
Recent & Upcoming Earth-asteroid encounters: | Asteroid | Date(UT) | Miss Distance | Velocity (km/s) | Diameter (m) |
| 2019 LL1 | 2019-Jun-14 | 5.6 LD | 8.9 | 15 |
| 2013 YA14 | 2019-Jun-14 | 14.7 LD | 11.1 | 65 |
| 2019 KJ | 2019-Jun-14 | 12.6 LD | 8.1 | 68 |
| 2019 LB6 | 2019-Jun-15 | 13.6 LD | 14.9 | 88 |
| 2019 LQ4 | 2019-Jun-15 | 12.8 LD | 11.4 | 39 |
| 2019 LU | 2019-Jun-16 | 4.2 LD | 8 | 33 |
| 2019 LR | 2019-Jun-16 | 18.3 LD | 15 | 34 |
| 2019 LU4 | 2019-Jun-18 | 2 LD | 8.1 | 18 |
| 2019 LA5 | 2019-Jun-18 | 18.3 LD | 7.7 | 29 |
| 2019 LC1 | 2019-Jun-19 | 19.2 LD | 9.9 | 26 |
| 2019 LB2 | 2019-Jun-20 | 6.5 LD | 3.4 | 15 |
| 2019 LM1 | 2019-Jun-23 | 9.8 LD | 8.7 | 26 |
| 2019 LC5 | 2019-Jun-23 | 13.6 LD | 11.1 | 42 |
| 441987 | 2019-Jun-24 | 7.7 LD | 12.6 | 178 |
| 2008 KV2 | 2019-Jun-27 | 17.8 LD | 11.4 | 195 |
| 2016 NN15 | 2019-Jun-28 | 9.6 LD | 8.4 | 16 |
| 2019 LR4 | 2019-Jun-29 | 11.3 LD | 8.3 | 31 |
| 2019 LV1 | 2019-Jun-29 | 5.2 LD | 6.2 | 26 |
| 2015 XC352 | 2019-Jul-01 | 11.9 LD | 4.1 | 26 |
| 2016 OF | 2019-Jul-07 | 12.8 LD | 8.5 | 85 |
| 2016 NO56 | 2019-Jul-07 | 3.4 LD | 12.2 | 26 |
| 2019 KD3 | 2019-Jul-12 | 15.5 LD | 8 | 89 |
| 2016 NJ33 | 2019-Jul-12 | 15 LD | 4.5 | 32 |
| 2015 HM10 | 2019-Jul-24 | 12.2 LD | 9.5 | 68 |
| 2010 PK9 | 2019-Jul-26 | 8.2 LD | 16.5 | 155 |
| 2006 QQ23 | 2019-Aug-10 | 19.4 LD | 4.7 | 339 |
| 454094 | 2019-Aug-12 | 17 LD | 8.2 | 148 |
| 2018 PN22 | 2019-Aug-17 | 17.1 LD | 2.3 | 11 |
Notes: LD means "Lunar Distance." 1 LD = 384,401 km, the distance between Earth and the Moon. 1 LD also equals 0.00256 AU. MAG is the visual magnitude of the asteroid on the date of closest approach. | | Cosmic Rays in the Atmosphere |
SOMETHING NEW! We have developed a new predictive model of aviation radiation. It's called E-RAD--short for Empirical RADiation model. We are constantly flying radiation sensors onboard airplanes over the US and and around the world, so far collecting more than 22,000 gps-tagged radiation measurements. Using this unique dataset, we can predict the dosage on any flight over the USA with an error no worse than 15%.
E-RAD lets us do something new: Every day we monitor approximately 1400 flights criss-crossing the 10 busiest routes in the continental USA. Typically, this includes more than 80,000 passengers per day. E-RAD calculates the radiation exposure for every single flight.
The Hot Flights Table is a daily summary of these calculations. It shows the 5 charter flights with the highest dose rates; the 5 commercial flights with the highest dose rates; 5 commercial flights with near-average dose rates; and the 5 commercial flights with the lowest dose rates. Passengers typically experience dose rates that are 20 to 70 times higher than natural radiation at sea level.
To measure radiation on airplanes, we use the same sensors we fly to the stratosphere onboard Earth to Sky Calculus cosmic ray balloons: neutron bubble chambers and X-ray/gamma-ray Geiger tubes sensitive to energies between 10 keV and 20 MeV. These energies span the range of medical X-ray machines and airport security scanners.
Column definitions: (1) The flight number; (2) The maximum dose rate during the flight, expressed in units of natural radiation at sea level; (3) The maximum altitude of the plane in feet above sea level; (4) Departure city; (5) Arrival city; (6) Duration of the flight.
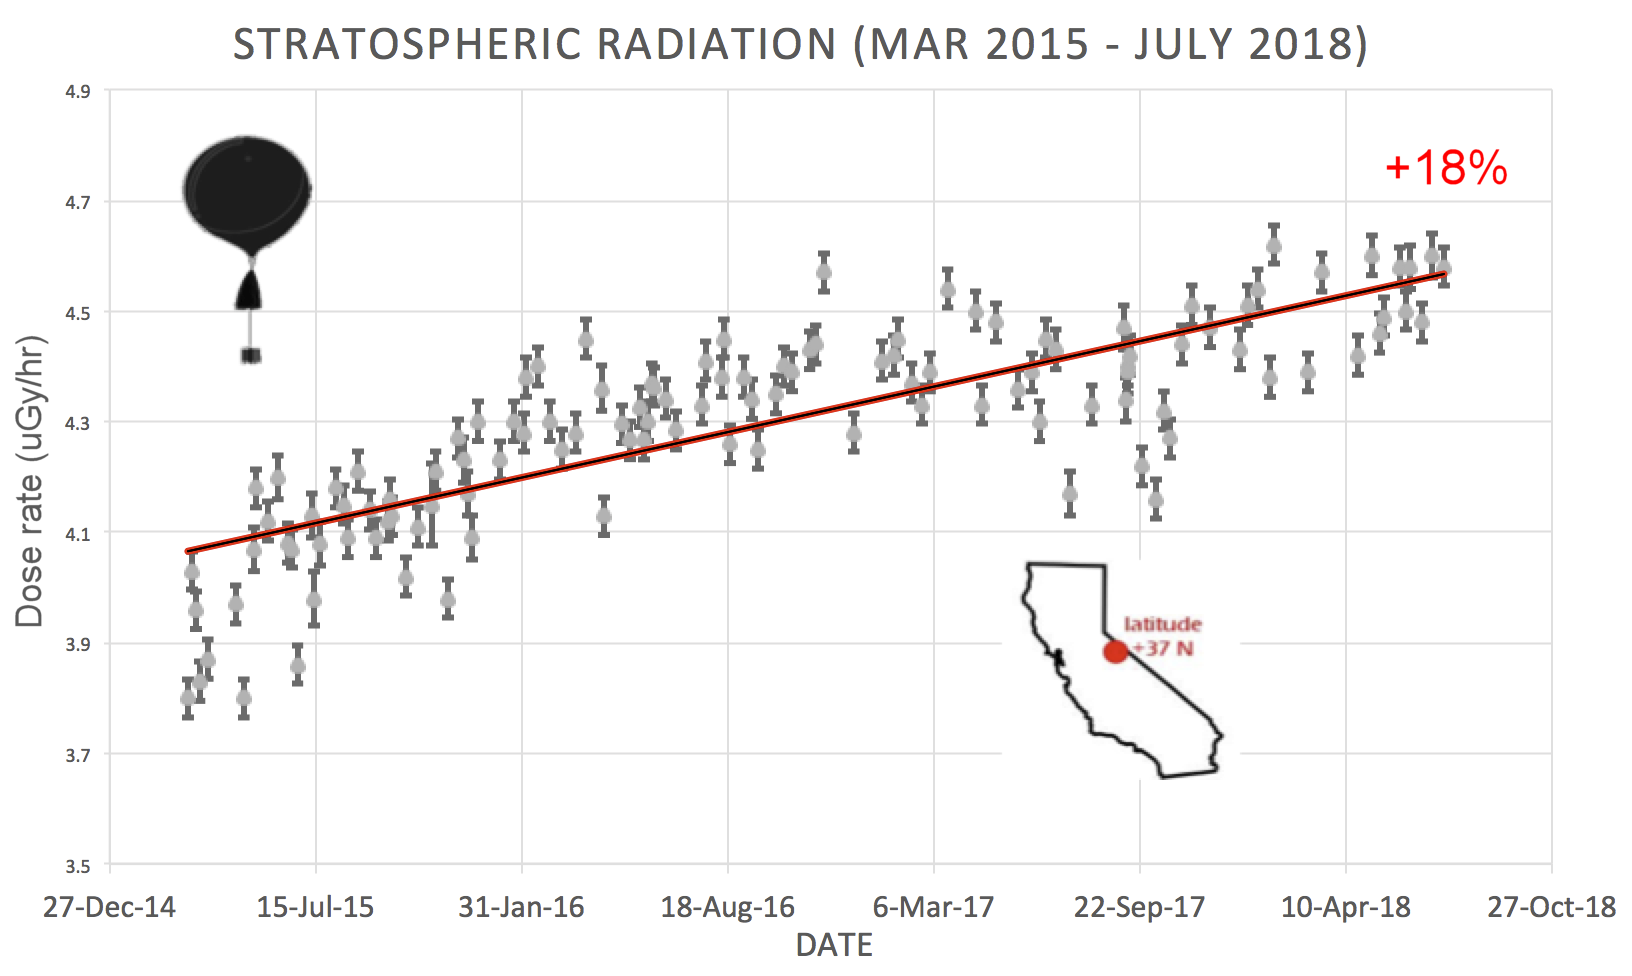
SPACE WEATHER BALLOON DATA: Approximately once a week, Spaceweather.com and the students of Earth to Sky Calculus fly space weather balloons to the stratosphere over California. These balloons are equipped with radiation sensors that detect cosmic rays, a surprisingly "down to Earth" form of space weather. Cosmic rays can seed clouds, trigger lightning, and penetrate commercial airplanes. Furthermore, there are studies ( #1, #2, #3, #4) linking cosmic rays with cardiac arrhythmias and sudden cardiac death in the general population. Our latest measurements show that cosmic rays are intensifying, with an increase of more than 18% since 2015:
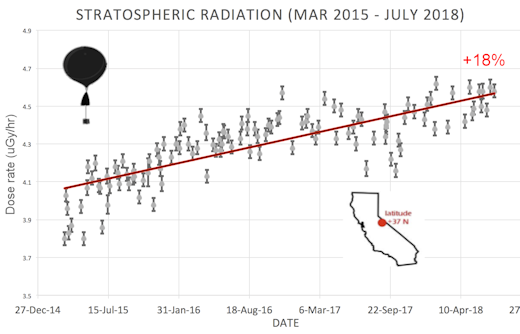
The data points in the graph above correspond to the peak of the Reneger-Pfotzer maximum, which lies about 67,000 feet above central California. When cosmic rays crash into Earth's atmosphere, they produce a spray of secondary particles that is most intense at the entrance to the stratosphere. Physicists Eric Reneger and Georg Pfotzer discovered the maximum using balloons in the 1930s and it is what we are measuring today.
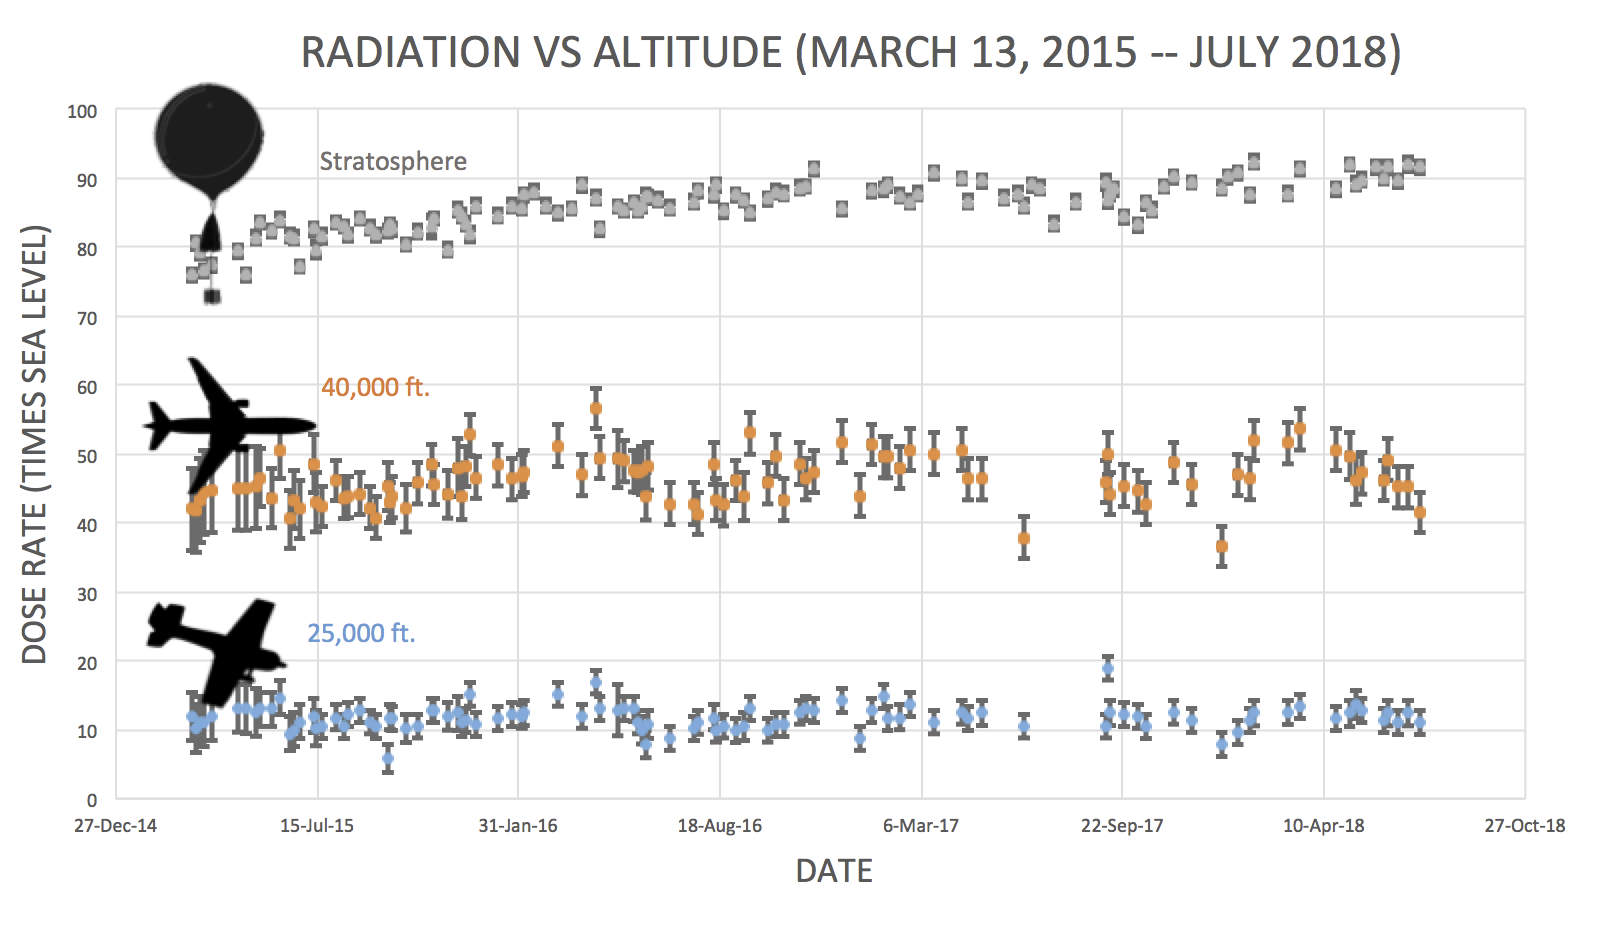
En route to the stratosphere, our sensors also pass through aviation altitudes:
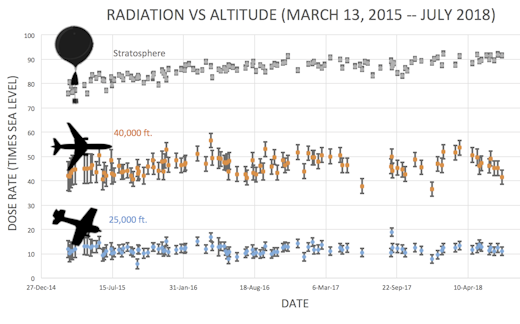
In this plot, dose rates are expessed as multiples of sea level. For instance, we see that boarding a plane that flies at 25,000 feet exposes passengers to dose rates ~10x higher than sea level. At 40,000 feet, the multiplier is closer to 50x.
The radiation sensors onboard our helium balloons detect X-rays and gamma-rays in the energy range 10 keV to 20 MeV. These energies span the range of medical X-ray machines and airport security scanners.
Why are cosmic rays intensifying? The main reason is the sun. Solar storm clouds such as coronal mass ejections (CMEs) sweep aside cosmic rays when they pass by Earth. During Solar Maximum, CMEs are abundant and cosmic rays are held at bay. Now, however, the solar cycle is swinging toward Solar Minimum, allowing cosmic rays to return. Another reason could be the weakening of Earth's magnetic field, which helps protect us from deep-space radiation.
| | The official U.S. government space weather bureau |
| | The first place to look for information about sundogs, pillars, rainbows and related phenomena. |
| | Researchers call it a "Hubble for the sun." SDO is the most advanced solar observatory ever. |
| | 3D views of the sun from NASA's Solar and Terrestrial Relations Observatory |
| | Realtime and archival images of the Sun from SOHO. |
| | from the NOAA Space Environment Center |
| | fun to read, but should be taken with a grain of salt! Forecasts looking ahead more than a few days are often wrong. |
| | from the NOAA Space Environment Center |
| | the underlying science of space weather |
 | To find reviews of new online casino sites in the UK try The Casino DB where there are hundreds of online casino reviews complete with bonuses and ratings. Looking for a new online casino? Try Casimpo the new site dedicated to making online casino simple and easy for all. |
| | These links help Spaceweather.com stay online. Thank you to our supporters! |
| | | | | | |


