Spotless Days Current Stretch: 0 days 2018 total: 203 days (59%) 2017 total: 104 days (28%) 2016 total: 32 days (9%) 2015 total: 0 days (0%) 2014 total: 1 day (<1%) 2013 total: 0 days (0%) 2012 total: 0 days (0%) 2011 total: 2 days (<1%) 2010 total: 51 days (14%) 2009 total: 260 days (71%) 2008 total: 268 days (73%) 2007 total: 152 days (42%) 2006 total: 70 days (19%) Updated 10 Dec 2018
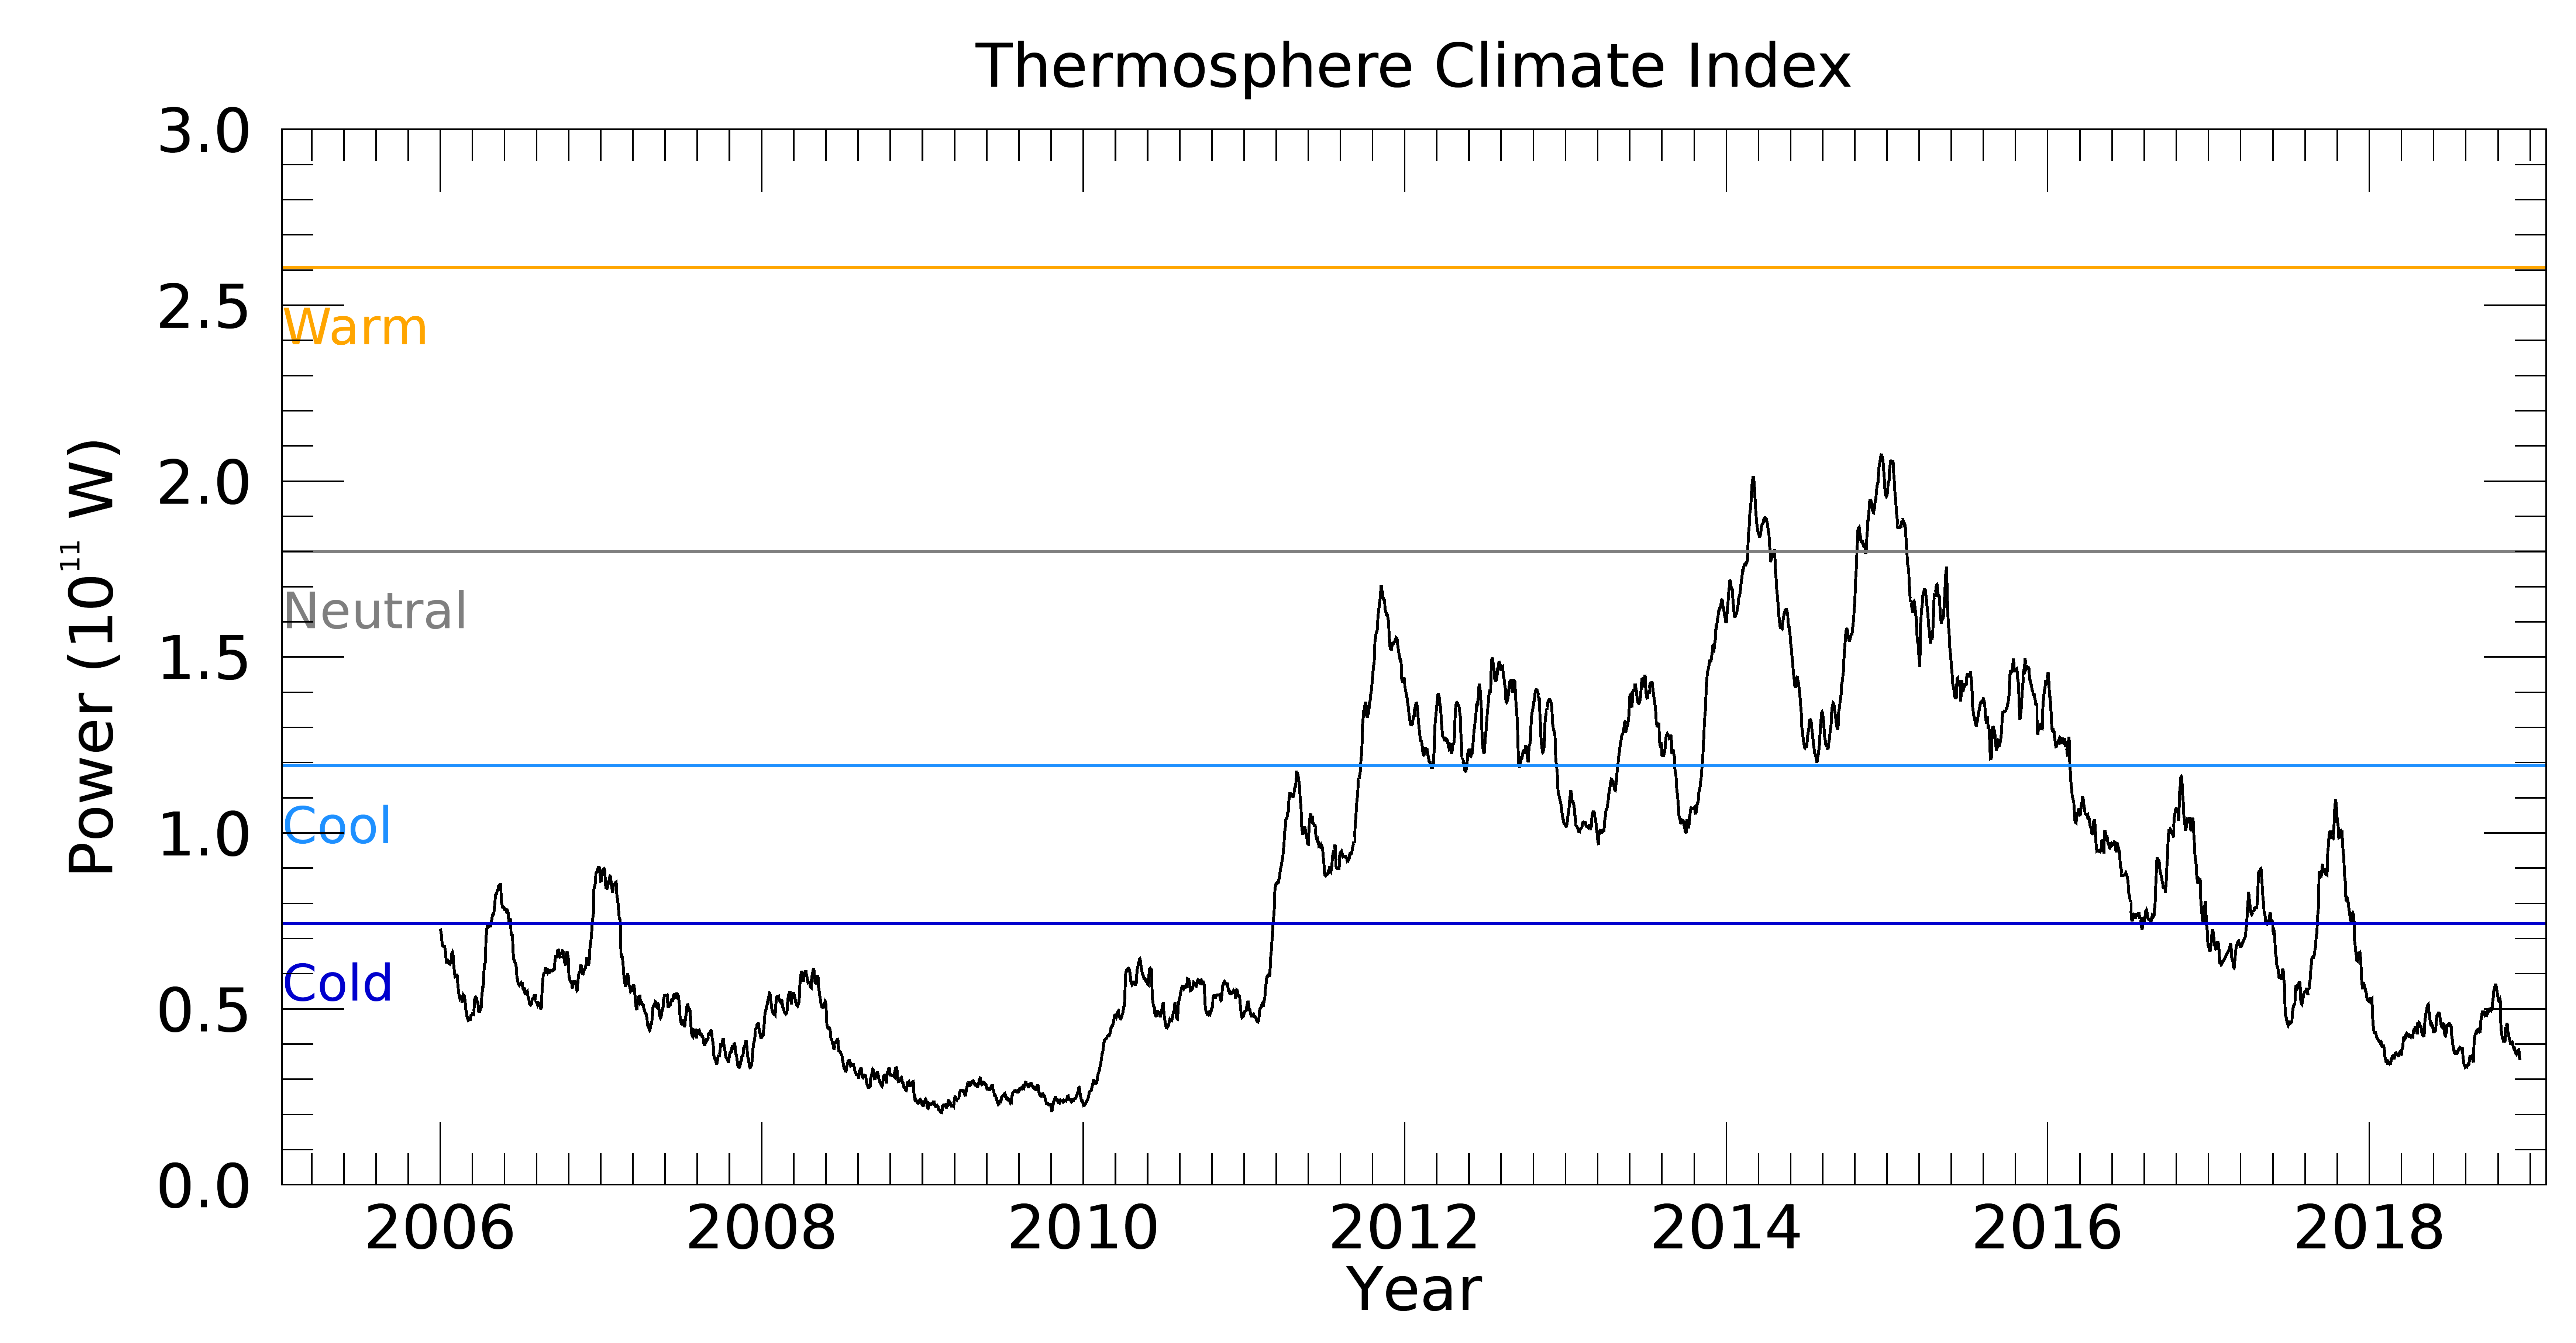
Thermosphere Climate Index today: 3.40x10¹⁰W Cold Max: 49.4x10¹⁰ W Hot (10/1957) Min: 2.05x10¹⁰W Cold (02/2009) explanation | more data Updated 10 Dec 2018
Planetary K-index Now: Kp= 2 quiet 24-hr max: Kp= 3 quiet explanation | more data
Interplanetary Mag. Field Btotal: 4.2 nT Bz: 1.3 nT north more data: ACE, DSCOVR Updated: Today at 2307 UT
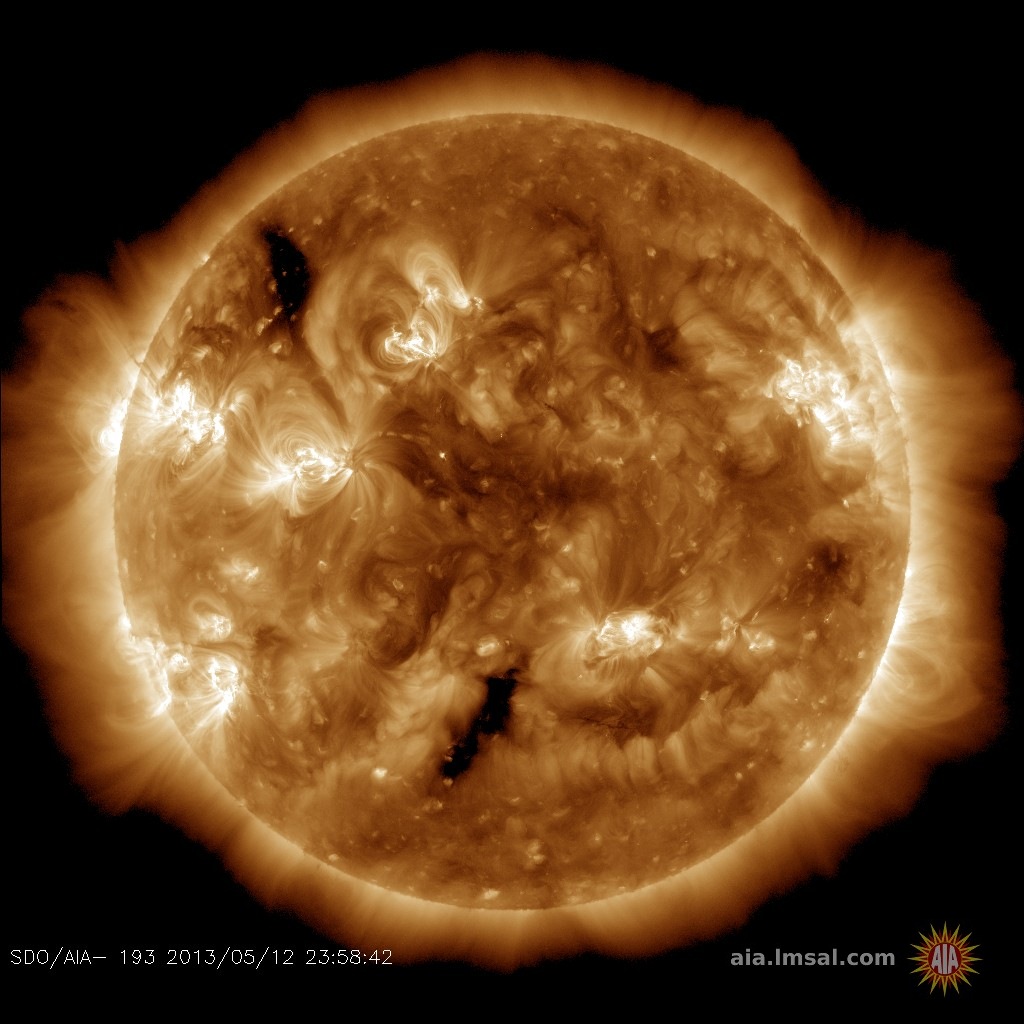
Coronal Holes: 10 Dec 18
Earth is inside a stream of solar wind flowing from the indicated coronal hole. Credit: SDO/AIA
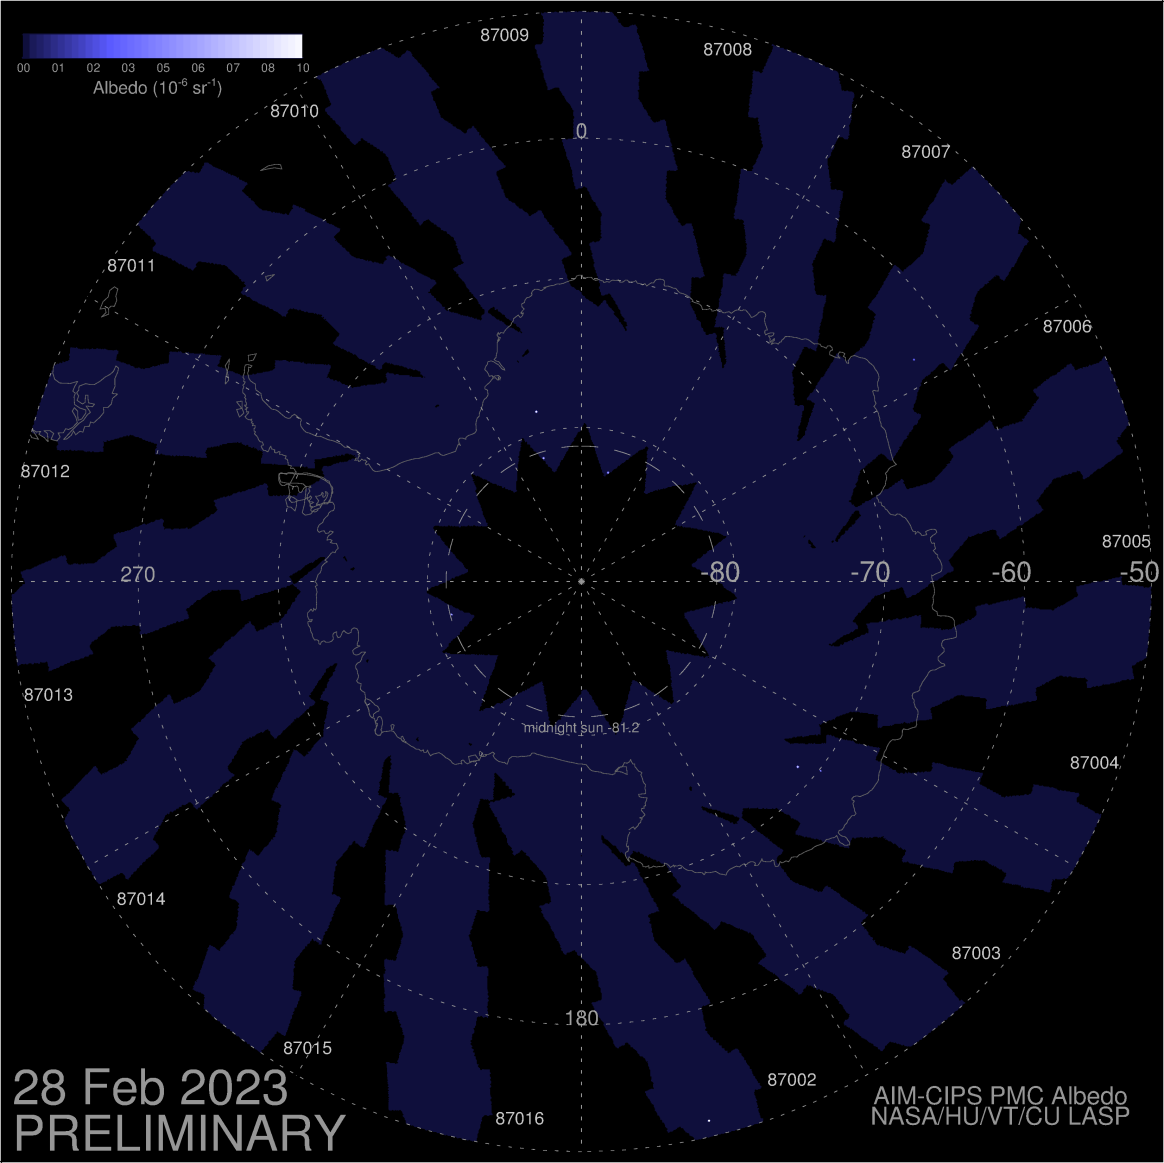
Noctilucent CloudsThe southern season for noctilucent clouds (NLCs) has begun! NASA's AIM spacecraft is detecting electric blue clouds at the edge of space over Antarctica.
Geomagnetic Storms: Probabilities for significant disturbances in Earth's magnetic field are given for three activity levels: active, minor storm, severe storm
Updated at: 2018 Dec 10 2200 UTC
Mid-latitudes
0-24 hr
24-48 hr
ACTIVE
10 %
15 %
MINOR
01 %
05 %
SEVERE
01 %
01 %
High latitudes
0-24 hr
24-48 hr
ACTIVE
15 %
15 %
MINOR
15 %
25 %
SEVERE
15 %
25 %
Monday, Dec. 10, 2018
What's up in space
Lights Over Lapland has a brand-new website full of exciting adventures in Abisko National Park, Sweden! Take a look at our aurora activities and book your once-in-a-lifetime trip with us today!
MAGNETIC MISMATCH IN THE SOLAR WIND: For the third day in a row, Earth is inside a stream of fast-moving solar wind. Inside the stream, wind speeds are topping 600 km/s--yet there have been no geomagnetic storms. Why not? There's a mismatch: Magnetic fields inside the solar wind stream are pointing North, the same direction as Earth's magnetic field. "North" versus "North" prevents the type of magnetic link-up that leads to storming. Even without a storm, however, Arctic sky watchers have seen a few beautifulauroras. Free:Aurora Alerts.
VOYAGER 2 ENTERS INTERSTELLAR SPACE: Voyager 2 has exited the sun's magnetic bubble and entered interstellar space. Mission scientists announced the breakthrough earlier today at the American Geophysical Union meeting in Washington DC. Its twin, Voyager 1, crossed the same boundary in 2012, but Voyager 2's crossing is arguably more significant because it carries a working instrument that can sense interstellar plasmas, providing the first in situ sampling of matter between the stars.
The most compelling evidence of Voyager 2's exit from the heliosphere came from its onboard Plasma Science Experiment (PLS), an instrument that stopped working on Voyager 1 in 1980. Until recently, Voyager 2 was surrounded mainly by the solar wind--a type of plasma flowing outward from the sun. On Nov. 5th, Voyager 2's plasma instrument observed a sharp decline in the solar wind, and since that date, it has observed no solar wind flow--a clear sign that the probe has left the heliosphere.
Replacing the solar wind is a blizzard of galactic cosmic rays. The sun's magnetic field substantially protects the solar system from cosmic rays, fending off the high energy debris of supernova explosions in the Milky Way and elsewhere. Now that Voyager 2 has exited that protective shell, it is baldly exposed to cosmic rays, and its cosmic ray subsystem is registering a surge.
Launched in 1977, Voyager 2 now is slightly more than 11 billion miles (18 billion kilometers) from Earth. Mission operators still can communicate with Voyager 2 as it enters this new phase of its journey, but information – moving at the speed of light – takes about 16.5 hours to travel from the spacecraft to Earth.
The Voyager probes are powered using heat from the decay of radioactive material, contained in a radioisotope thermal generator (RTG). The power output of the RTGs diminishes by about four watts per year, which means that various parts of the Voyagers, including the cameras on both spacecraft, have been turned off over time to manage power. Thanks to these precautions, the Voyagers could continue to send back at least some data for years to come.
"There is still a lot to learn about the region of interstellar space immediately beyond the heliosphere," said Ed Stone, Voyager project scientist based at Caltech in Pasadena, California. Stay tuned for updates from the stars.
CHRISTMAS GIFTS FROM THE EDGE OF SPACE: So far in 2018, the students of Earth to Sky Calculus have launched 42 space weather balloons to the stratosphere, measuring cosmic rays over 3 continents, 2 hemispheres, and 7 different US states. You can help them pay their helium bill by purchasing a Christmas gift from the edge of space:
Every item in the Earth to Sky Store has flown to the stratosphere alongside an array of cosmic ray sensors. Carried aloft by giant balloons, these unique gifts travel above 99.7% of Earth's atmosphere, experiencing space-like blasts of cosmic rays, extreme cold, and a wild ride parachuting back to Earth after the balloon explodes. Even Amazon doesn't carry items this far out!
Don't forget to enter coupon code "SPACESANTA" at checkout for a 10% holiday discount.
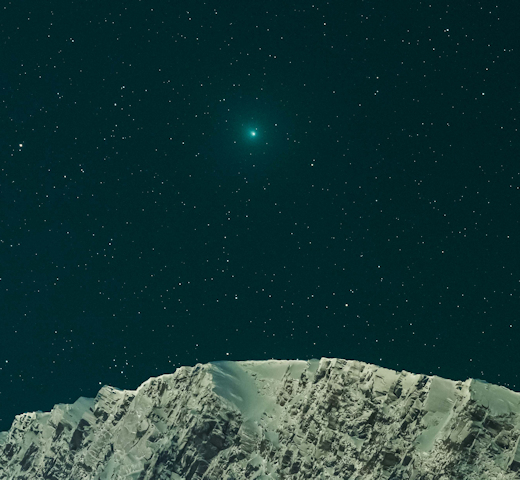
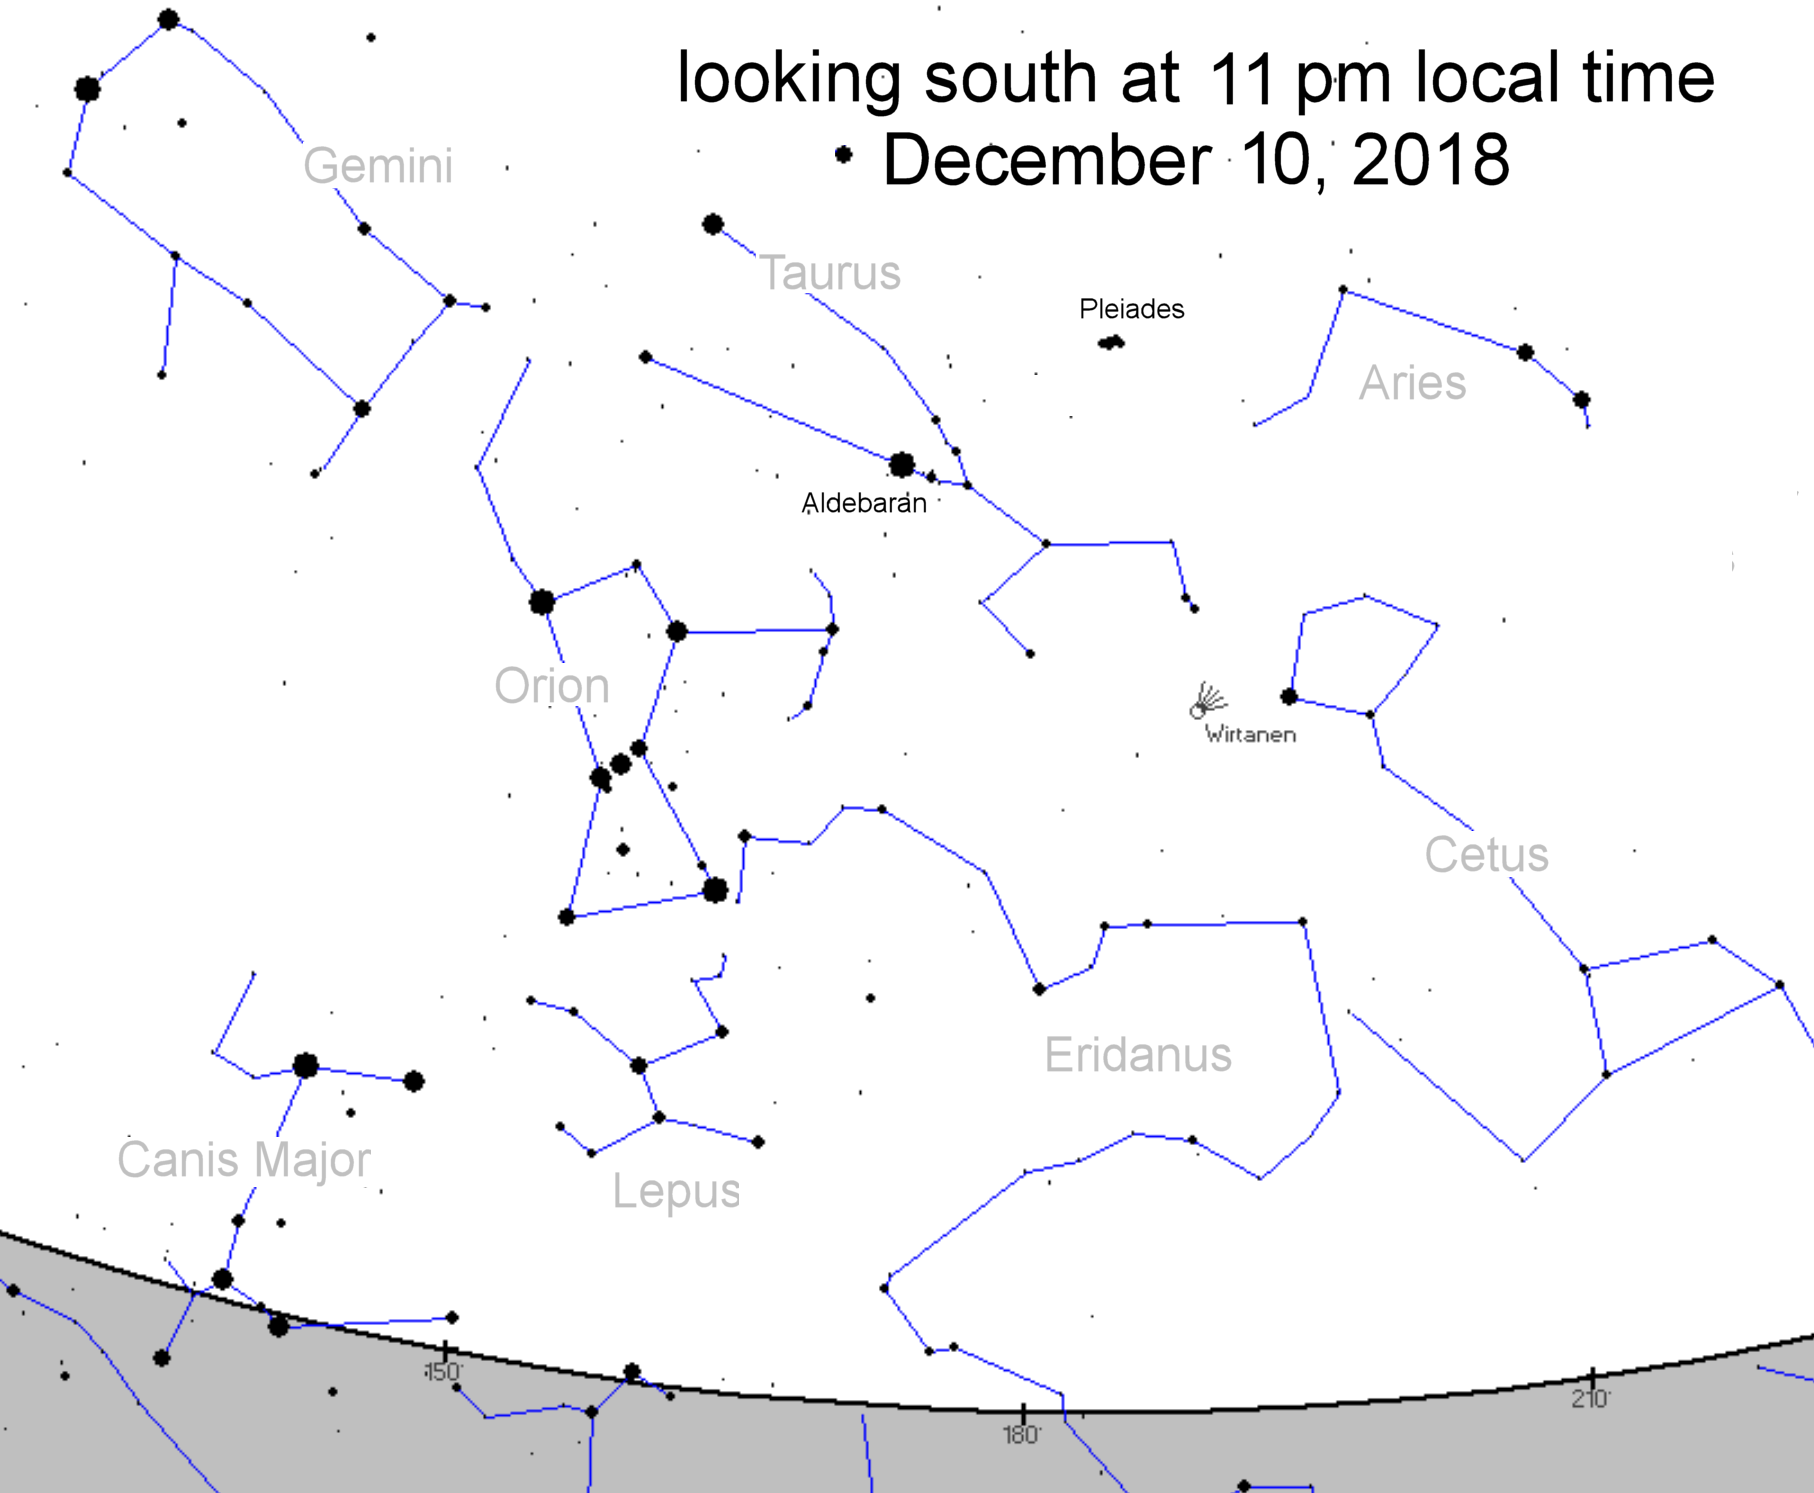
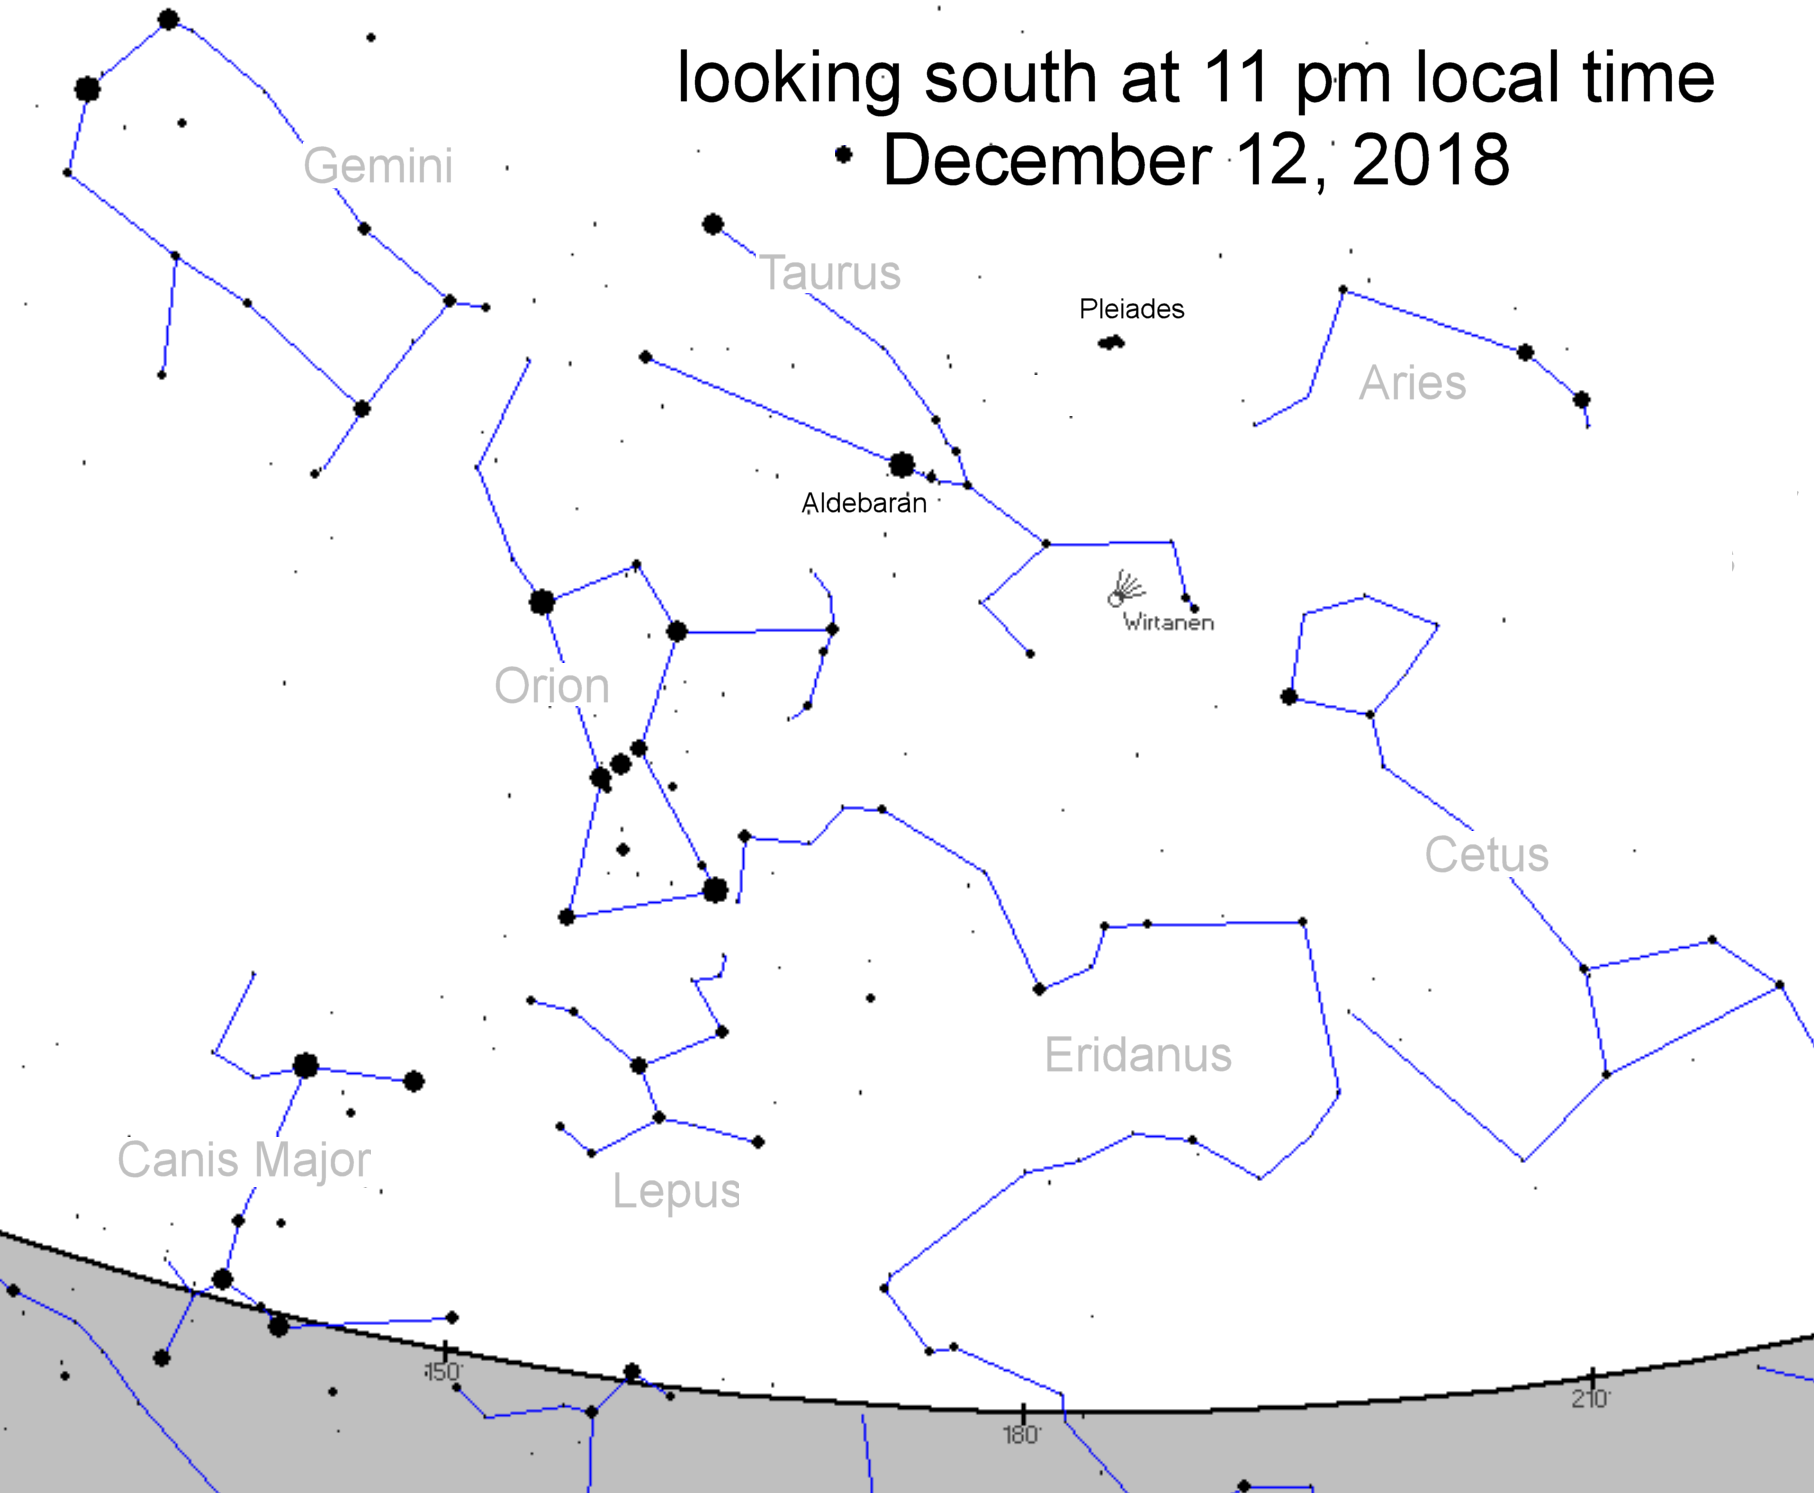
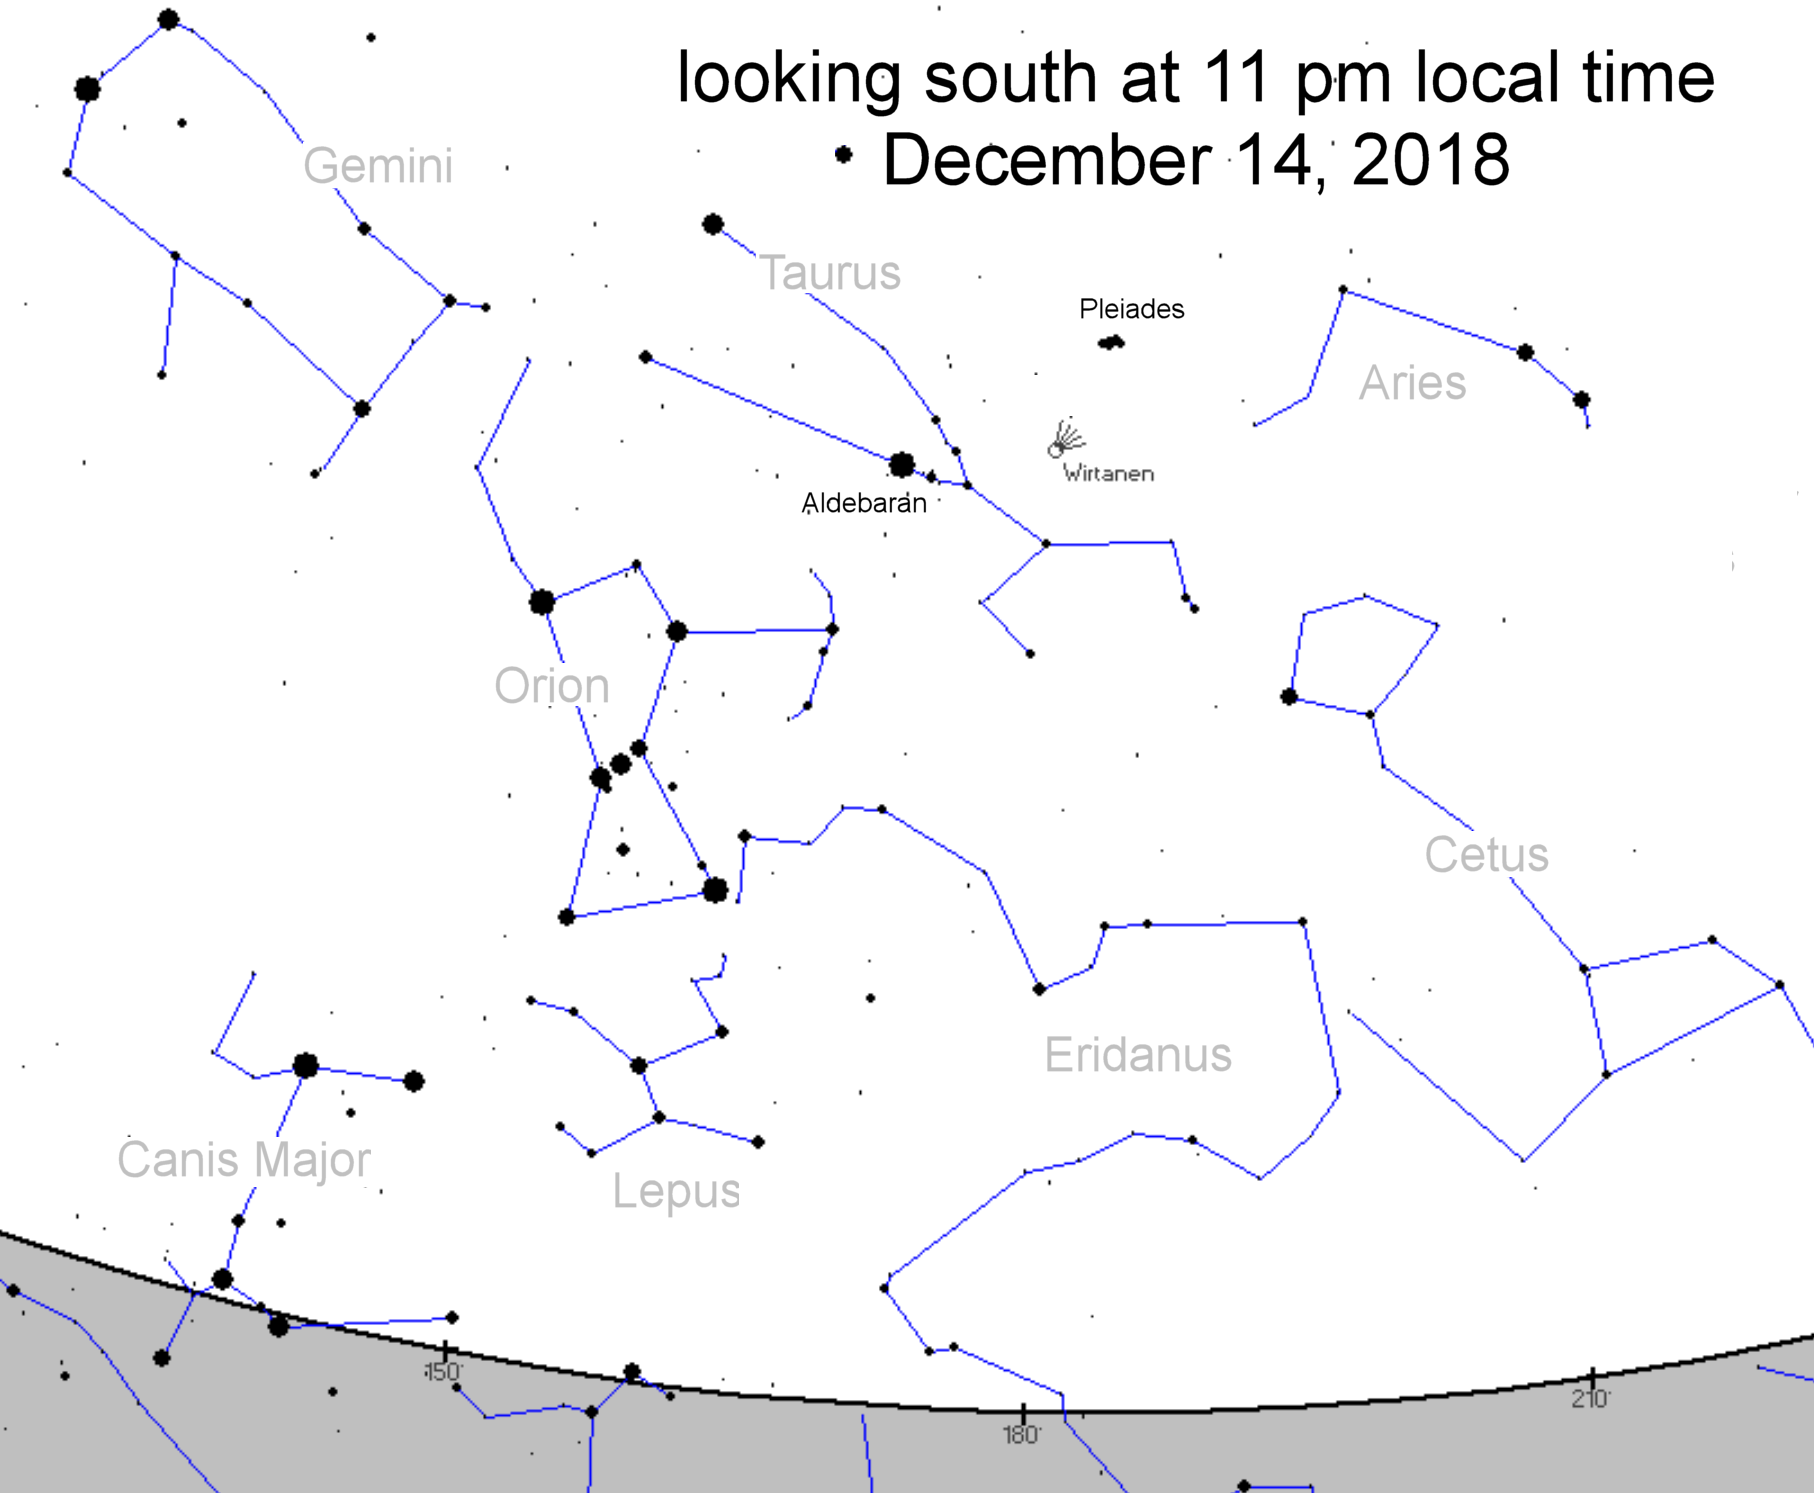
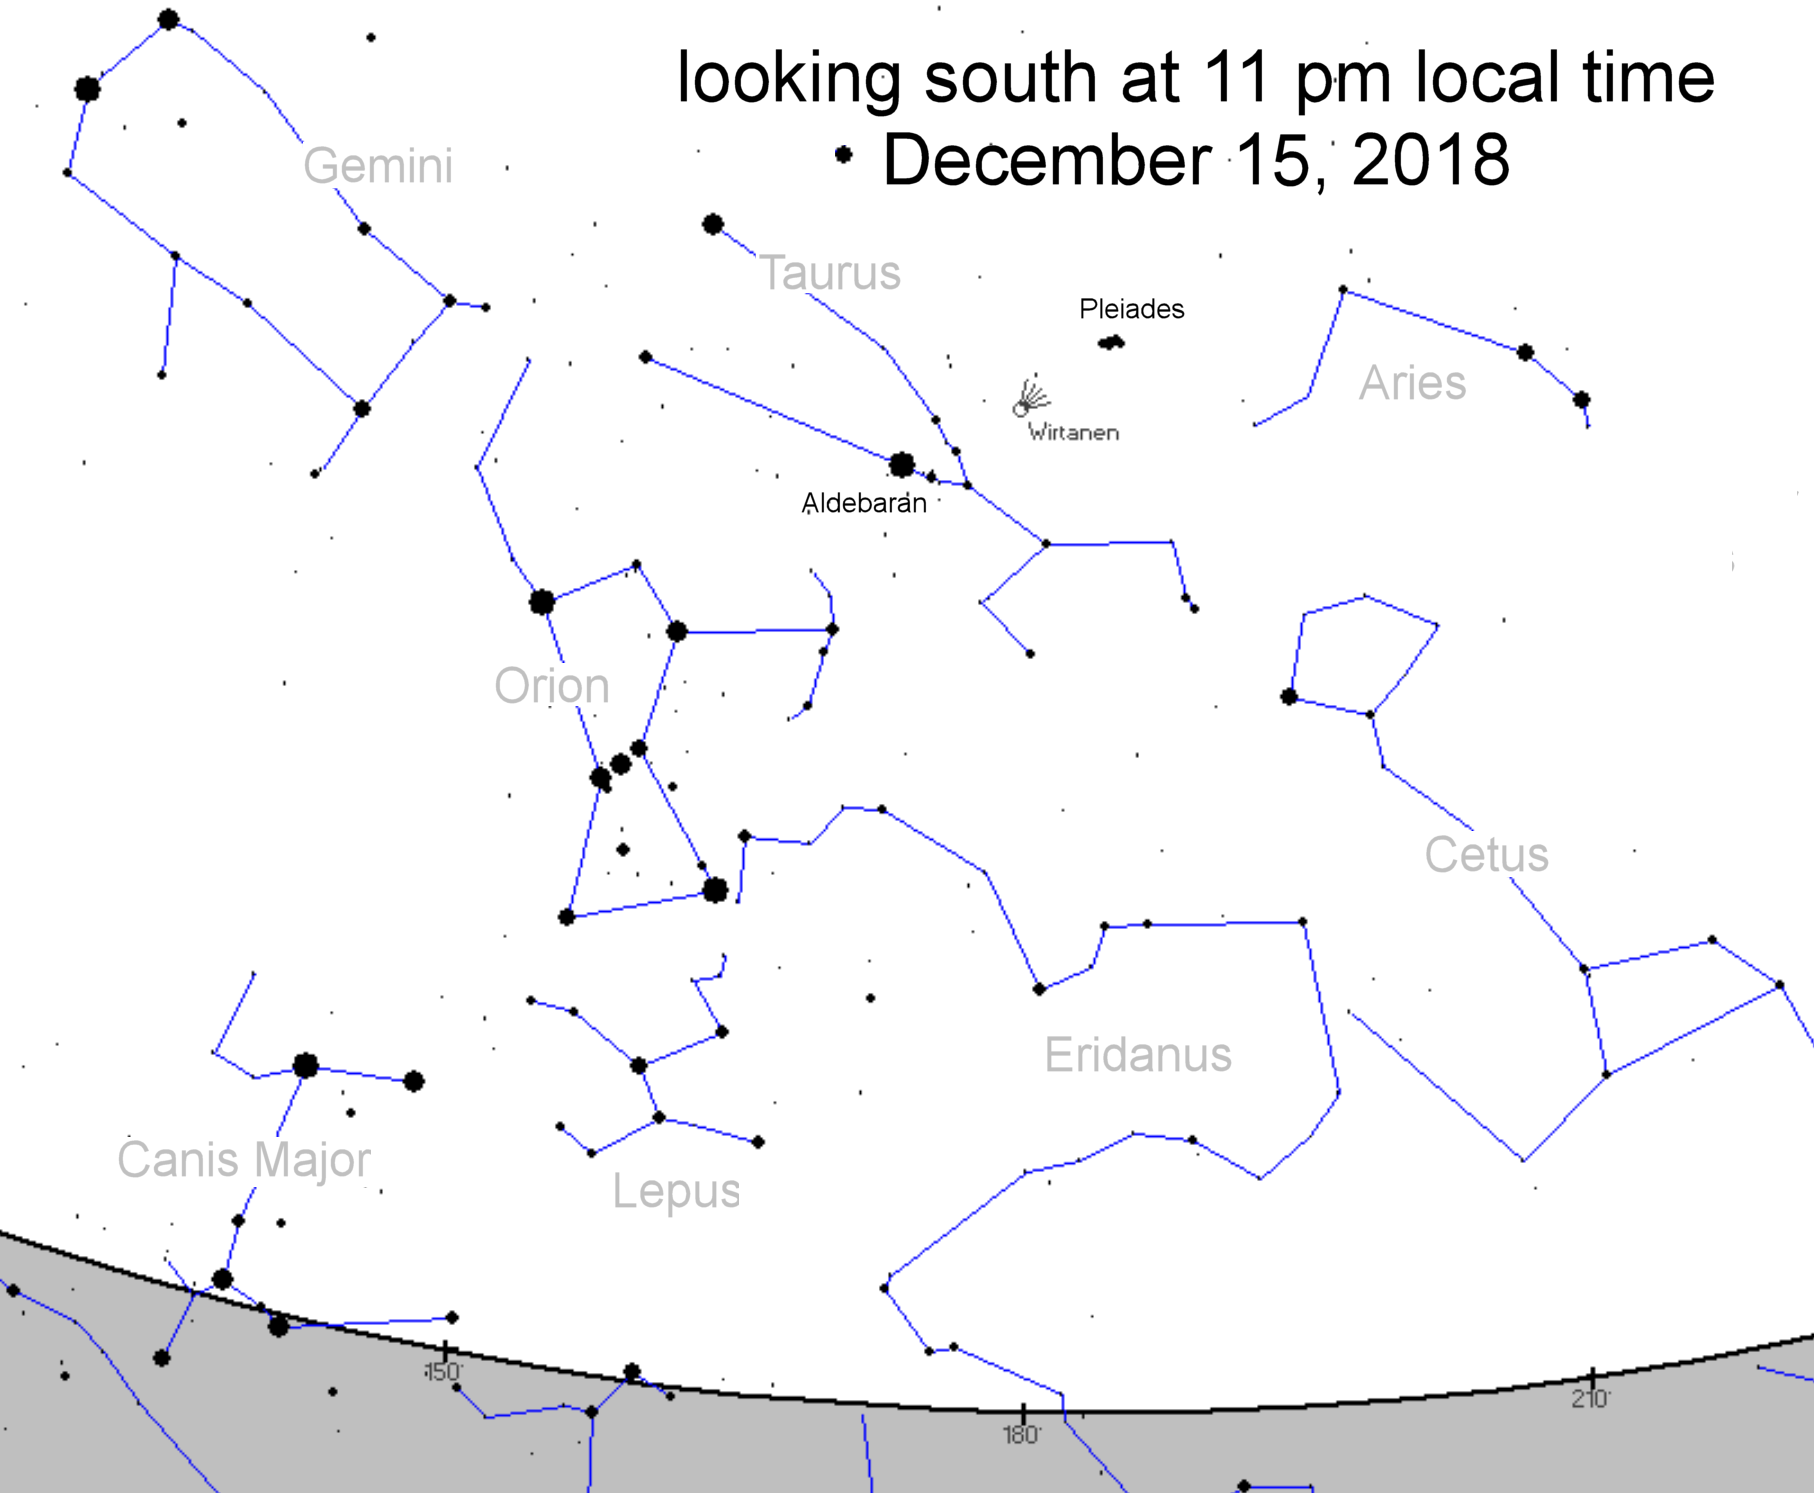
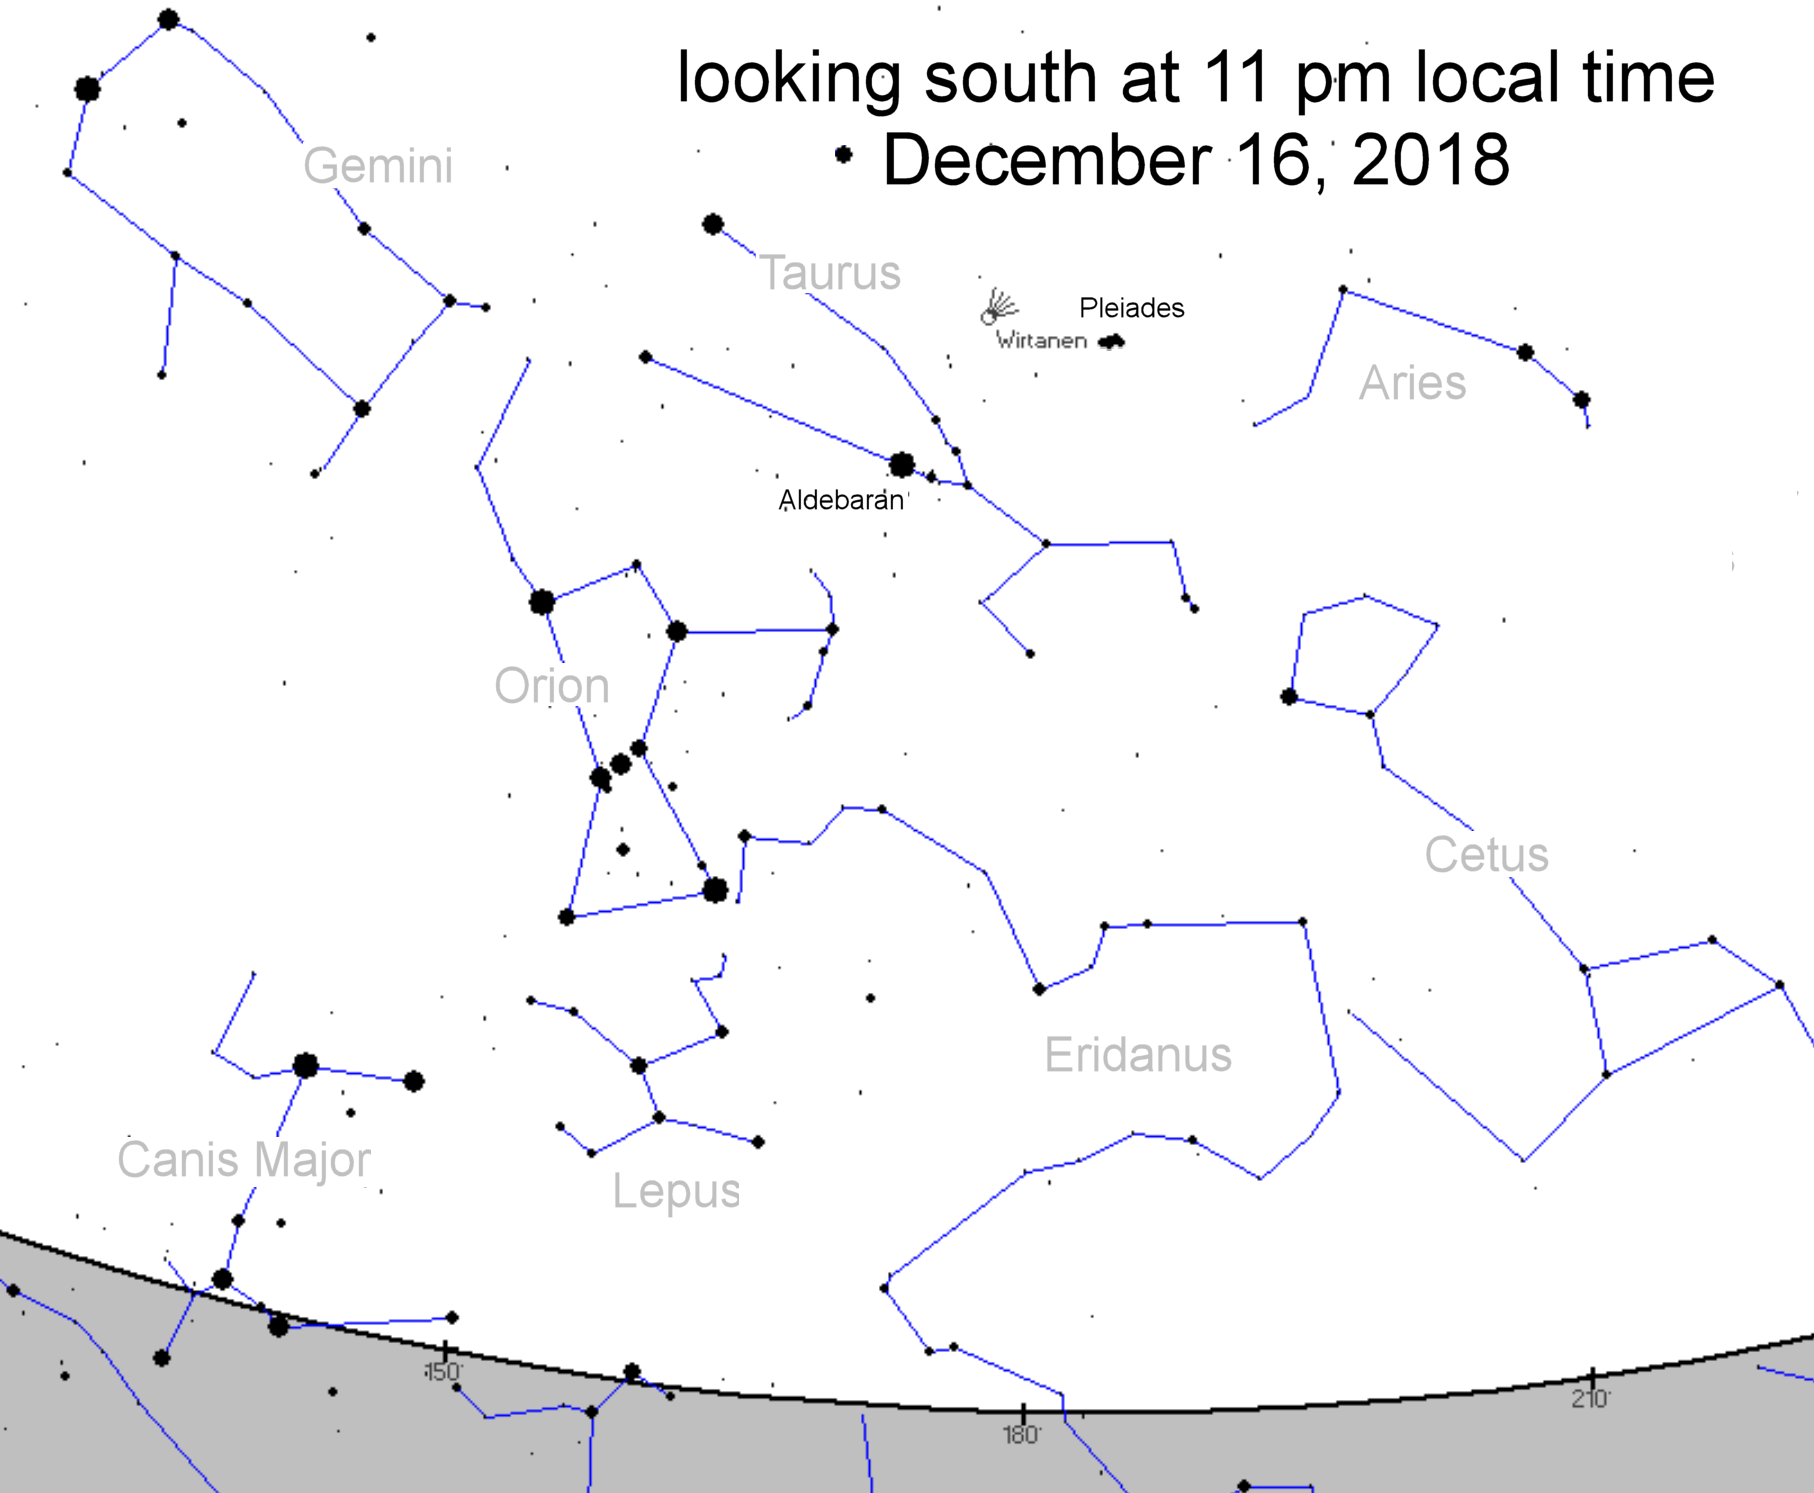
BRIGHTENING COMET WIRTANEN: Comet 46P/Wirtanen is nearing Earth for one of the 10 closest Earth-comet encounters of the Space Age. Closest approach: Dec. 16th. Observers say that the comet may now be seen with the unaided eye from dark rural areas, "appearing as a huge 1 degree misty cloud," reports Chris Schur of Payson, Arizona. "It is a photographers dream." Indeed, just last night Bernt Olsen of Troms, Norway, took this picture using only a camera--no telescope required:
"Comet Wirtanen was rising above the mountain, Isfjellet," he says. "This is a composite of five 30-second exposures using my Nikon D810a set at ISO 3200."
The view will improve in the nights ahead. The comet is already shining like a (big fuzzy) star of 5th magnitude, and its brightness could increase another 3 to 5-fold. On Dec. 16th, the green comet will be nicely positioned in the constellation Taurus for easy viewing by observers in the northern hemisphere. Use these sky maps to plan your photos: Dec. 10, Dec. 11, Dec. 12, Dec. 13, Dec. 14, Dec. 15, Dec. 16
Every night, a network of NASA all-sky cameras scans the skies above the United States for meteoritic fireballs. Automated software maintained by NASA's Meteoroid Environment Office calculates their orbits, velocity, penetration depth in Earth's atmosphere and many other characteristics. Daily results are presented here on Spaceweather.com.
On Dec. 10, 2018, the network reported 33 fireballs. (25 sporadics, 6 Geminids, 1 December Monocerotid, 1 sigma Hydrid)
In this diagram of the inner solar system, all of the fireball orbits intersect at a single point--Earth. The orbits are color-coded by velocity, from slow (red) to fast (blue). [Larger image] [movies]
Near Earth Asteroids
Potentially Hazardous Asteroids (PHAs) are space rocks larger than approximately 100m that can come closer to Earth than 0.05 AU. None of the known PHAs is on a collision course with our planet, although astronomers are finding new ones all the time.
On December 10, 2018 there were 1936 potentially hazardous asteroids.
Notes: LD means "Lunar Distance." 1 LD = 384,401 km, the distance between Earth and the Moon. 1 LD also equals 0.00256 AU. MAG is the visual magnitude of the asteroid on the date of closest approach.
Cosmic Rays in the Atmosphere
SOMETHING NEW! We have developed a new predictive model of aviation radiation. It's called E-RAD--short for Empirical RADiation model. We are constantly flying radiation sensors onboard airplanes over the US and and around the world, so far collecting more than 22,000 gps-tagged radiation measurements. Using this unique dataset, we can predict the dosage on any flight over the USA with an error no worse than 15%.
E-RAD lets us do something new: Every day we monitor approximately 1400 flights criss-crossing the 10 busiest routes in the continental USA. Typically, this includes more than 80,000 passengers per day. E-RAD calculates the radiation exposure for every single flight.
The Hot Flights Table is a daily summary of these calculations. It shows the 5 charter flights with the highest dose rates; the 5 commercial flights with the highest dose rates; 5 commercial flights with near-average dose rates; and the 5 commercial flights with the lowest dose rates. Passengers typically experience dose rates that are 20 to 70 times higher than natural radiation at sea level.
To measure radiation on airplanes, we use the same sensors we fly to the stratosphere onboard Earth to Sky Calculus cosmic ray balloons: neutron bubble chambers and X-ray/gamma-ray Geiger tubes sensitive to energies between 10 keV and 20 MeV. These energies span the range of medical X-ray machines and airport security scanners.
Column definitions: (1) The flight number; (2) The maximum dose rate during the flight, expressed in units of natural radiation at sea level; (3) The maximum altitude of the plane in feet above sea level; (4) Departure city; (5) Arrival city; (6) Duration of the flight.
SPACE WEATHER BALLOON DATA: Approximately once a week, Spaceweather.com and the students of Earth to Sky Calculus fly space weather balloons to the stratosphere over California. These balloons are equipped with radiation sensors that detect cosmic rays, a surprisingly "down to Earth" form of space weather. Cosmic rays can seed clouds, trigger lightning, and penetrate commercial airplanes. Furthermore, there are studies ( #1, #2, #3, #4) linking cosmic rays with cardiac arrhythmias and sudden cardiac death in the general population. Our latest measurements show that cosmic rays are intensifying, with an increase of more than 18% since 2015:
The data points in the graph above correspond to the peak of the Reneger-Pfotzer maximum, which lies about 67,000 feet above central California. When cosmic rays crash into Earth's atmosphere, they produce a spray of secondary particles that is most intense at the entrance to the stratosphere. Physicists Eric Reneger and Georg Pfotzer discovered the maximum using balloons in the 1930s and it is what we are measuring today.
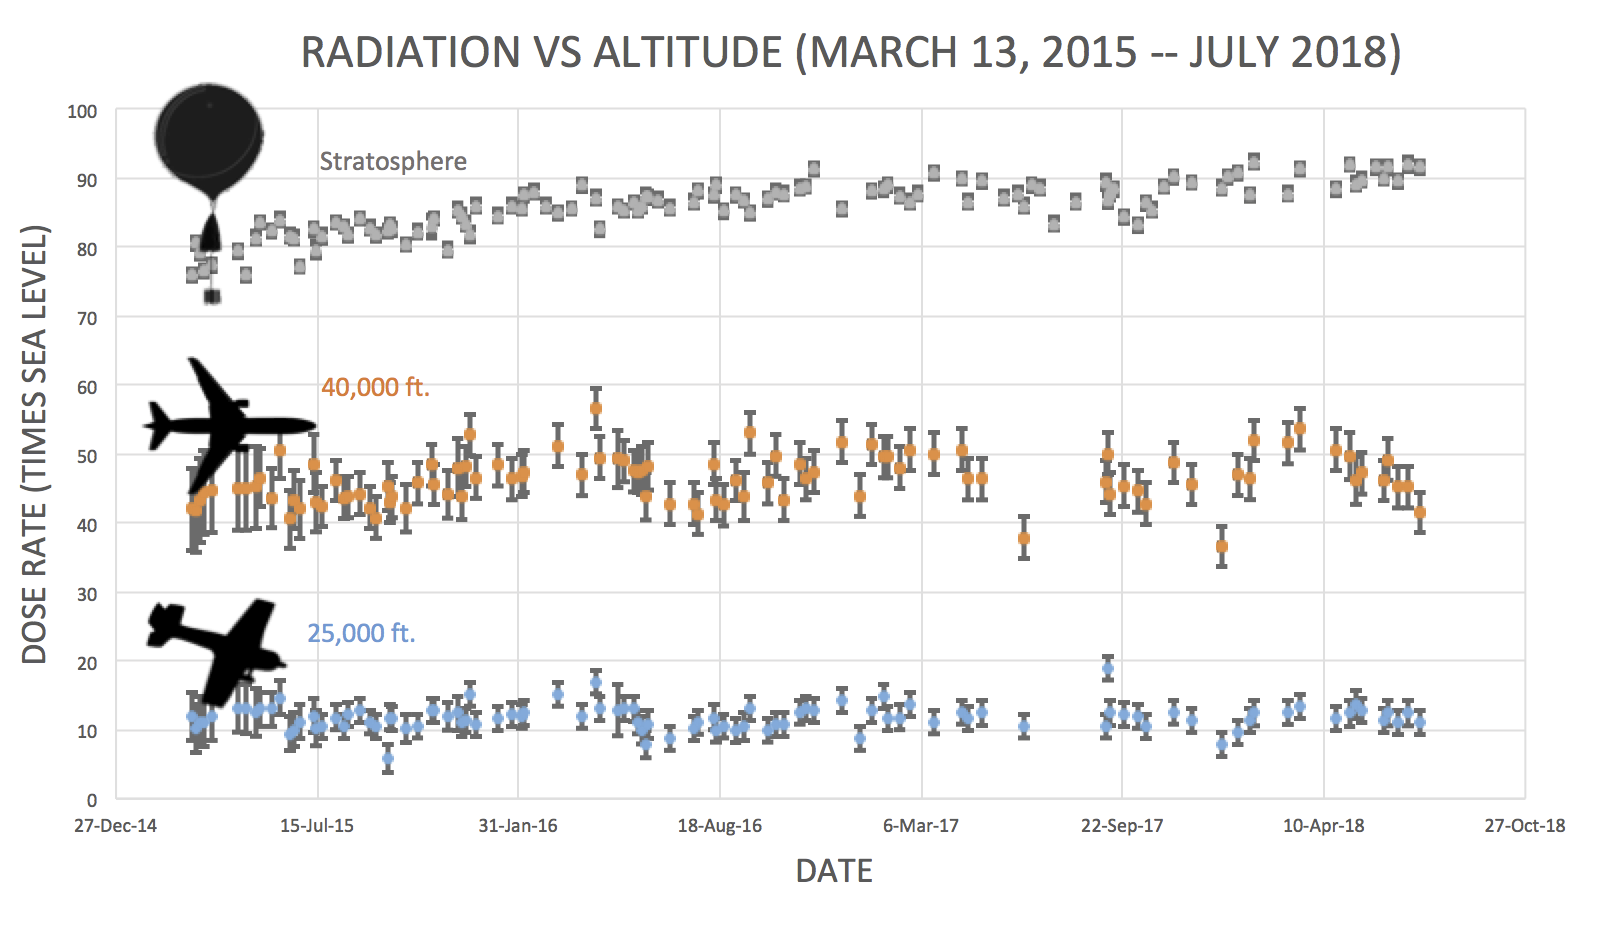
En route to the stratosphere, our sensors also pass through aviation altitudes:
In this plot, dose rates are expessed as multiples of sea level. For instance, we see that boarding a plane that flies at 25,000 feet exposes passengers to dose rates ~10x higher than sea level. At 40,000 feet, the multiplier is closer to 50x.
The radiation sensors onboard our helium balloons detect X-rays and gamma-rays in the energy range 10 keV to 20 MeV. These energies span the range of medical X-ray machines and airport security scanners.
Why are cosmic rays intensifying? The main reason is the sun. Solar storm clouds such as coronal mass ejections (CMEs) sweep aside cosmic rays when they pass by Earth. During Solar Maximum, CMEs are abundant and cosmic rays are held at bay. Now, however, the solar cycle is swinging toward Solar Minimum, allowing cosmic rays to return. Another reason could be the weakening of Earth's magnetic field, which helps protect us from deep-space radiation.
If you are a Youtuber and want to buy real Youtube views than try out Buyrealsocial.com for the best results possible!
To find reviews of new online casino sites in the UK try The Casino DB where there are hundreds of online casino reviews complete with bonuses and ratings.
Looking for a new online casino? Try Casimpo the new site dedicated to making online casino simple and easy for all.
These links help Spaceweather.com stay online. Thank you to our supporters!


