 | | | Switch to: Europe, USA, New Zealand, Antarctica Credit: NOAA/Ovation  Planetary K-index Planetary K-index
Now: Kp= 1 quiet
24-hr max: Kp= 2 quiet
explanation | more data
Interplanetary Mag. Field
Btotal: 2.8 nT
Bz: -0.4 nT south
more data: ACE, DSCOVR
Updated: Today at 2346 UT Coronal Holes: 06 Aug 18 
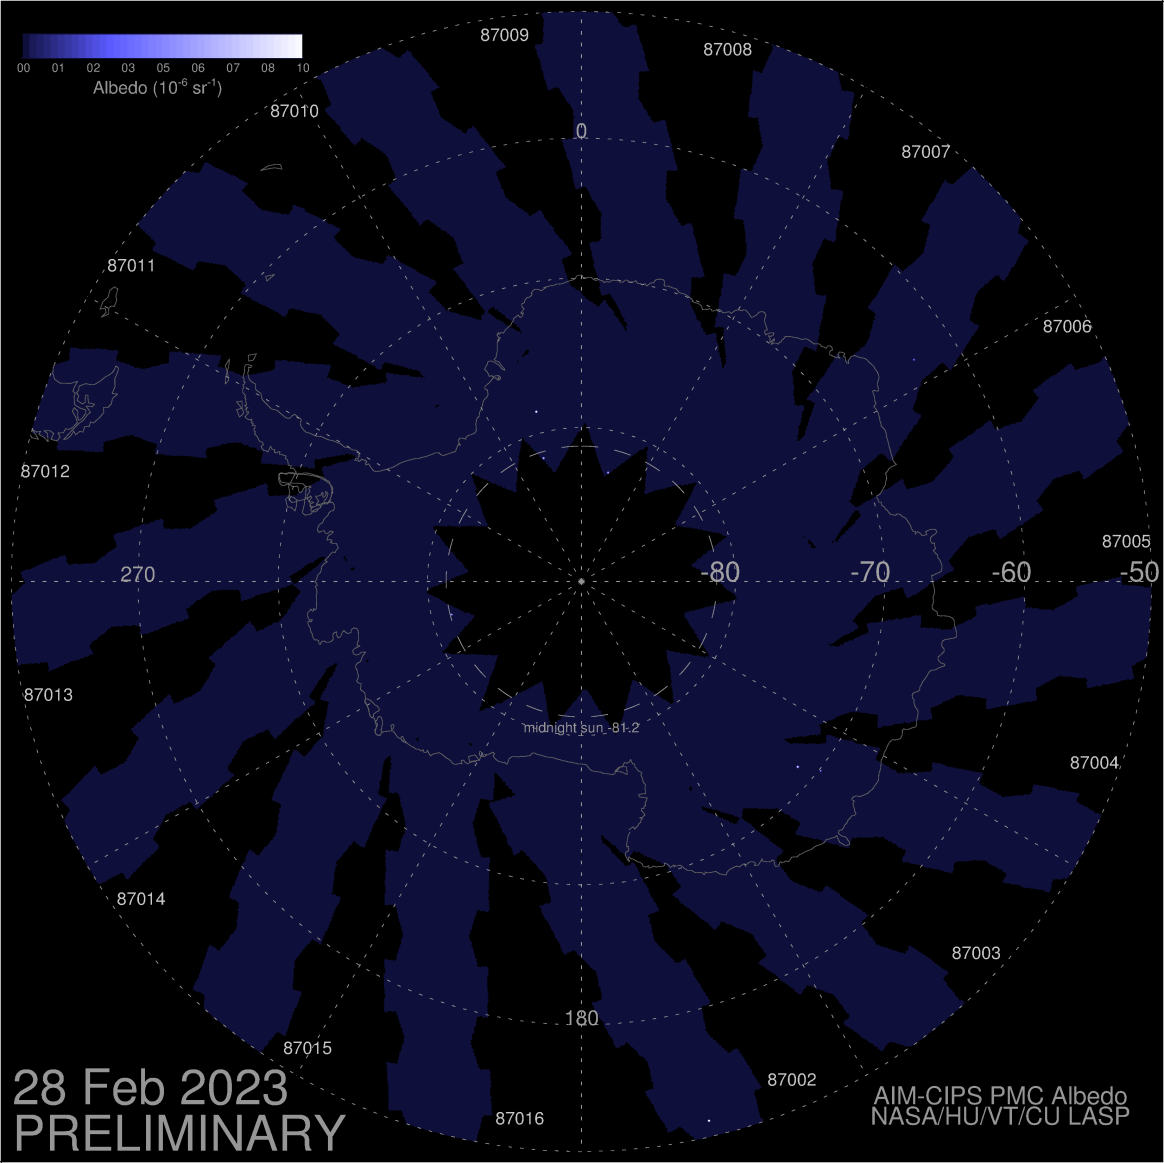
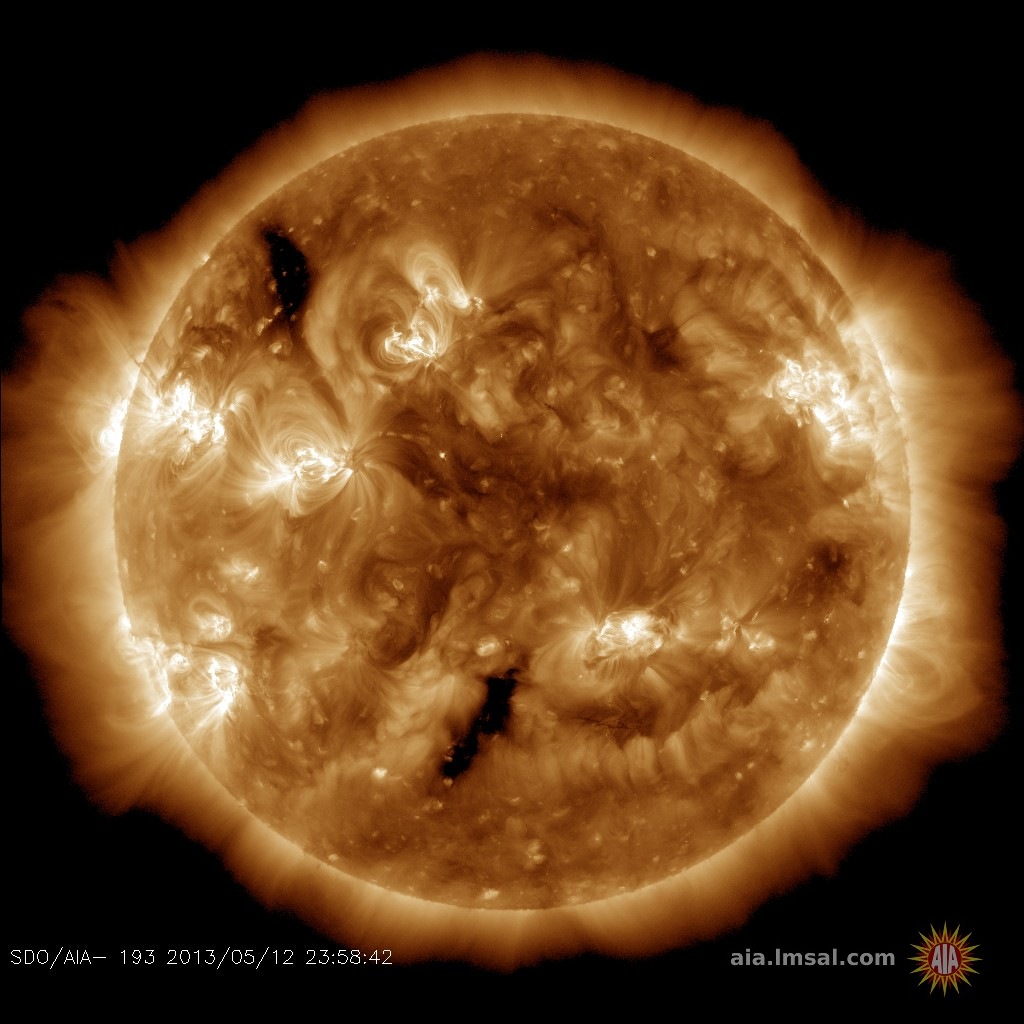
Solar wind flowing from this coronal hole could unsettle Earth's magnetic field on Aug. 6th and 7th. Credit: SDO/AIA  Noctilucent Clouds The season for noctilucent clouds in he northern hemisphere is underway. Check here daily for the latest images from NASA's AIM spacecraft. Switch view: Europe, USA, Asia, Polar Updated at: 08-06-2018 13:55:03 Noctilucent Clouds The season for noctilucent clouds in he northern hemisphere is underway. Check here daily for the latest images from NASA's AIM spacecraft. Switch view: Europe, USA, Asia, Polar Updated at: 08-06-2018 13:55:03 SPACE WEATHER
NOAA Forecasts | | Updated at: 2018 Aug 06 2200 UTC FLARE | 0-24 hr | 24-48 hr | CLASS M | 01 % | 01 % | CLASS X | 01 % | 01 % | Geomagnetic Storms:
Probabilities for significant disturbances in Earth's magnetic field are given for three activity levels: active, minor storm, severe storm Updated at: 2018 Aug 06 2200 UTC Mid-latitudes | 0-24 hr | 24-48 hr | ACTIVE | 20 % | 15 % | MINOR | 05 % | 05 % | SEVERE | 01 % | 01 % | High latitudes | 0-24 hr | 24-48 hr | ACTIVE | 15 % | 15 % | MINOR | 25 % | 20 % | SEVERE | 25 % | 20 % | | | |  | | | | | | | | | | | All-inclusive Northern Lights trips in Tromsø, Norway. Small groups, big experiences! Highly qualified guides ensure unique and unforgettable adventures with a personal touch. Visit Explore the Arctic | | | A SOLAR WIND STREAM APPROACHES: Minor geomagnetic unrest is possible on Aug. 7th when Earth passes through a stream of fast-moving solar wind. The gaseous material is flowing from a small hole in the sun's atmosphere. Wind speeds could top 500 km/s (1.1 million mph) according to NASA's STEREO-A spacecraft, which encountered the stream before Earth did. Free: Aurora alerts. THE PERSEID METEOR SHOWER IS UNDERWAY: You know a meteor shower is going to be good when it produces dozens of fireballs a whole week before the shower peaks. Welcome to the Perseids. The best meteor shower of the year peaks Aug. 11th-13th when Earth passes through a stream of debris from giant comet 109P/Swift-Tuttle. NASA's network of all-sky meteor cameras is already picking up strong activity over the USA, counting 66 Perseid fireballs during the three day period Aug. 4th-6th. Here's one of them, recorded Sunday morning above the Marshall Space Flight Center in Huntsville, Alabama: 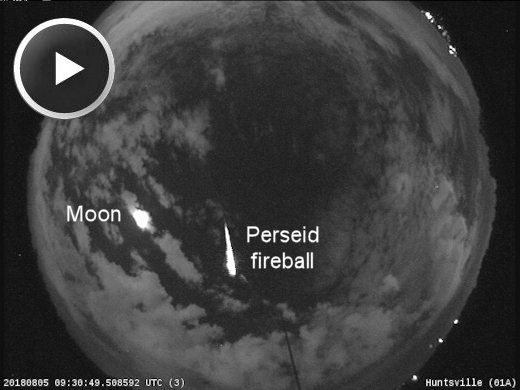
The fireball was nearly as bright as the Moon and the video shows it exploding just before it vanished.
The Perseid meteor shower is always good, but this year it is extra-good. The Moon will be New during the shower's peak, providing a dark backdrop for as many as 100 meteors per hour. The best time to look is during the dark hours before sunrise on Sunday, August 12th, and again on Monday, August 13th. At those times, the shower's radiant will be high in the sky, spewing meteors in all directions: 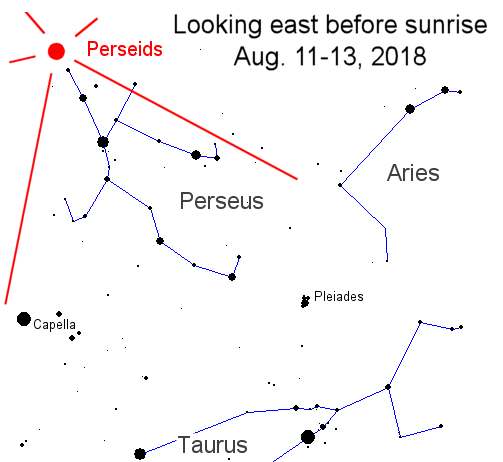
To see the greatest number of meteors, get away from city lights. Dress warmly, lie down on a blanket in a safe, dark place, and look up. Perseids can appear in any part of the sky, although all of their tails will point back toward the radiant in the constellation Perseus.
Fun tip: Try looking for Perseids around 10 pm local time when the radiant is hugging the northern horizon. At that time, Perseids skim the top of the atmosphere, producing long colorful fireballs known as "Earthgrazers." You won't see many, but even one can make your day. Enjoy the show! Realtime Space Weather Photo Gallery FAR-OUT OPTICS EXPERIMENT: Last week, the students of Earth to Sky Calculus flew a cosmic ray balloon to the stratosphere. A crystal globe went along for the ride. The young scientists wanted to see what Earth looked like when viewed through the spherical lens ... of Earth. Answer: very cool. Play the video to see for yourself: You can have this globe for $149.95. The students are selling them to support their high-altitude balloon program. Each one comes with a greeting card showing the crystal sphere in flight and telling the story of its journey to the edge of space. All sales support the Earth to Sky Calculus cosmic ray ballooning program and hands-on STEM research. Far Out Gifts: Earth to Sky Store
All sales support hands-on STEM education
Realtime Aurora Photo Gallery
Realtime Noctilucent Cloud Photo Gallery Every night, a network of NASA all-sky cameras scans the skies above the United States for meteoritic fireballs. Automated software maintained by NASA's Meteoroid Environment Office calculates their orbits, velocity, penetration depth in Earth's atmosphere and many other characteristics. Daily results are presented here on Spaceweather.com. On Aug. 6, 2018, the network reported 75 fireballs.
(42 sporadics, 29 Perseids, 2 alpha Capricornids, 1 , 1 Southern delta Aquariid)  In this diagram of the inner solar system, all of the fireball orbits intersect at a single point--Earth. The orbits are color-coded by velocity, from slow (red) to fast (blue). [Larger image] [movies] Potentially Hazardous Asteroids ( PHAs) are space rocks larger than approximately 100m that can come closer to Earth than 0.05 AU. None of the known PHAs is on a collision course with our planet, although astronomers are finding new ones all the time. On August 6, 2018 there were 1912 potentially hazardous asteroids.
 | Recent & Upcoming Earth-asteroid encounters: | Asteroid | Date(UT) | Miss Distance | Velocity (km/s) | Diameter (m) | | 2018 OZ | 2018-Aug-06 | 7 LD | 9.7 | 37 | | 2018 PC | 2018-Aug-06 | 12.1 LD | 9.3 | 54 | | 2018 LQ2 | 2018-Aug-27 | 9.4 LD | 1.5 | 39 | | 2016 GK135 | 2018-Aug-28 | 16.8 LD | 2.8 | 9 | | 2016 NF23 | 2018-Aug-29 | 13.3 LD | 9 | 93 | | 1998 SD9 | 2018-Aug-29 | 4.2 LD | 10.7 | 51 | | 2018 DE1 | 2018-Aug-30 | 15.2 LD | 6.5 | 28 | | 2001 RQ17 | 2018-Sep-02 | 19.3 LD | 8.3 | 107 | | 2015 FP118 | 2018-Sep-03 | 12.3 LD | 9.8 | 490 | | 2017 SL16 | 2018-Sep-20 | 8.5 LD | 6.4 | 25 | Notes: LD means "Lunar Distance." 1 LD = 384,401 km, the distance between Earth and the Moon. 1 LD also equals 0.00256 AU. MAG is the visual magnitude of the asteroid on the date of closest approach. | | Cosmic Rays in the Atmosphere |
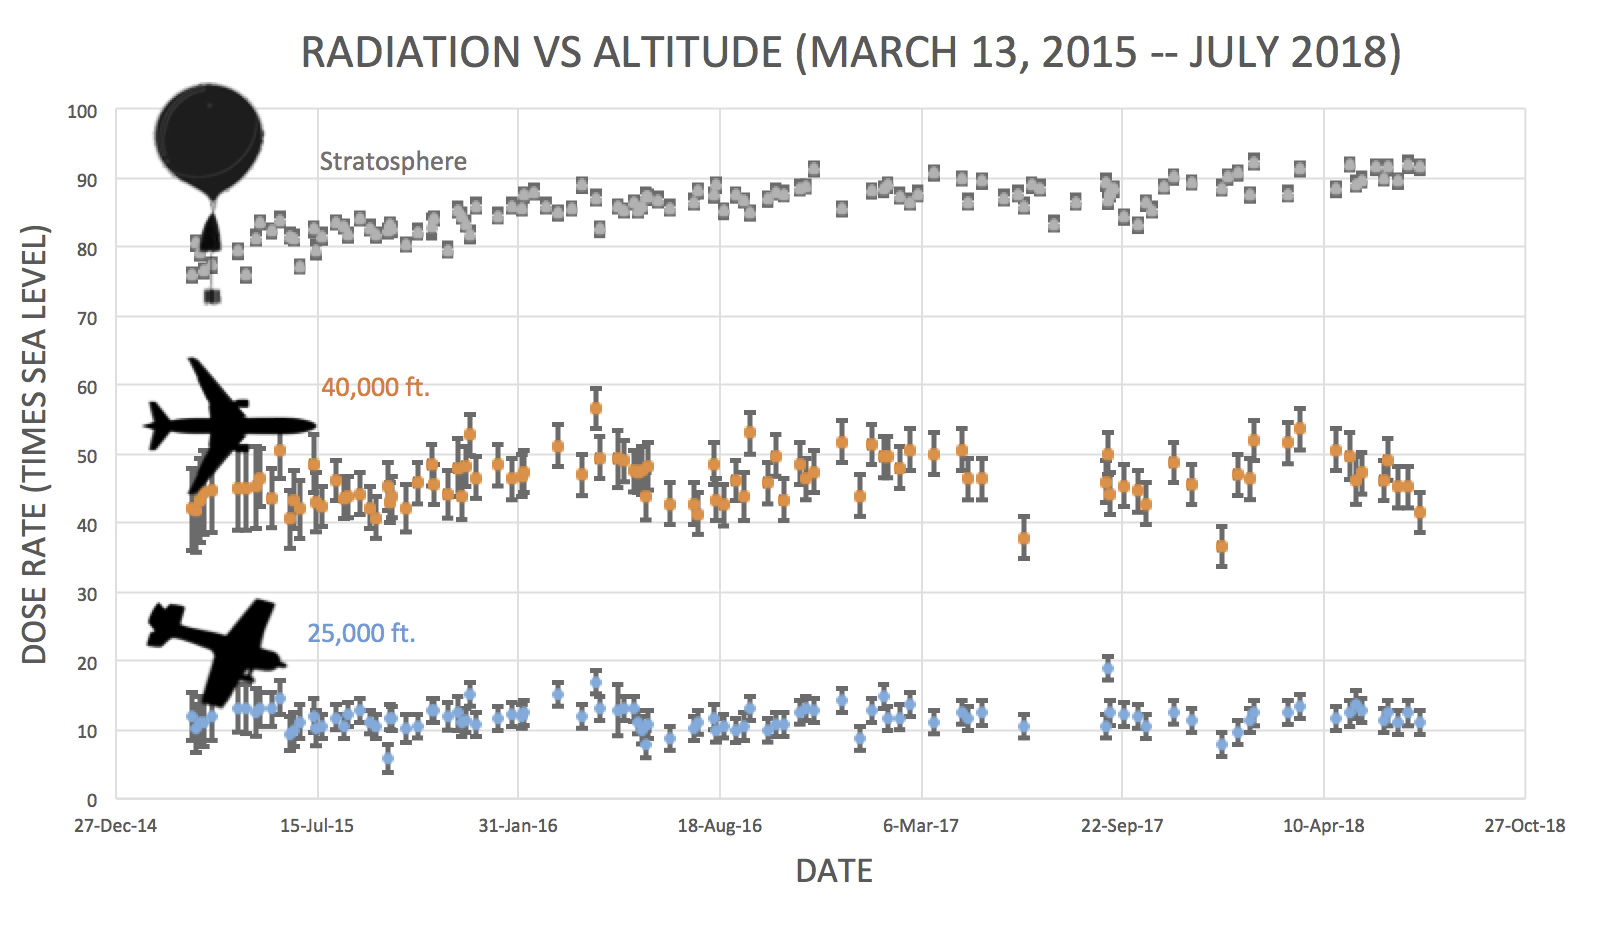
Readers, thank you for your patience while we continue to develop this new section of Spaceweather.com. We've been working to streamline our data reduction, allowing us to post results from balloon flights much more rapidly, and we have developed a new data product, shown here: 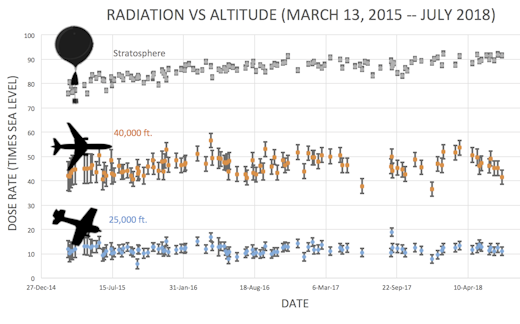
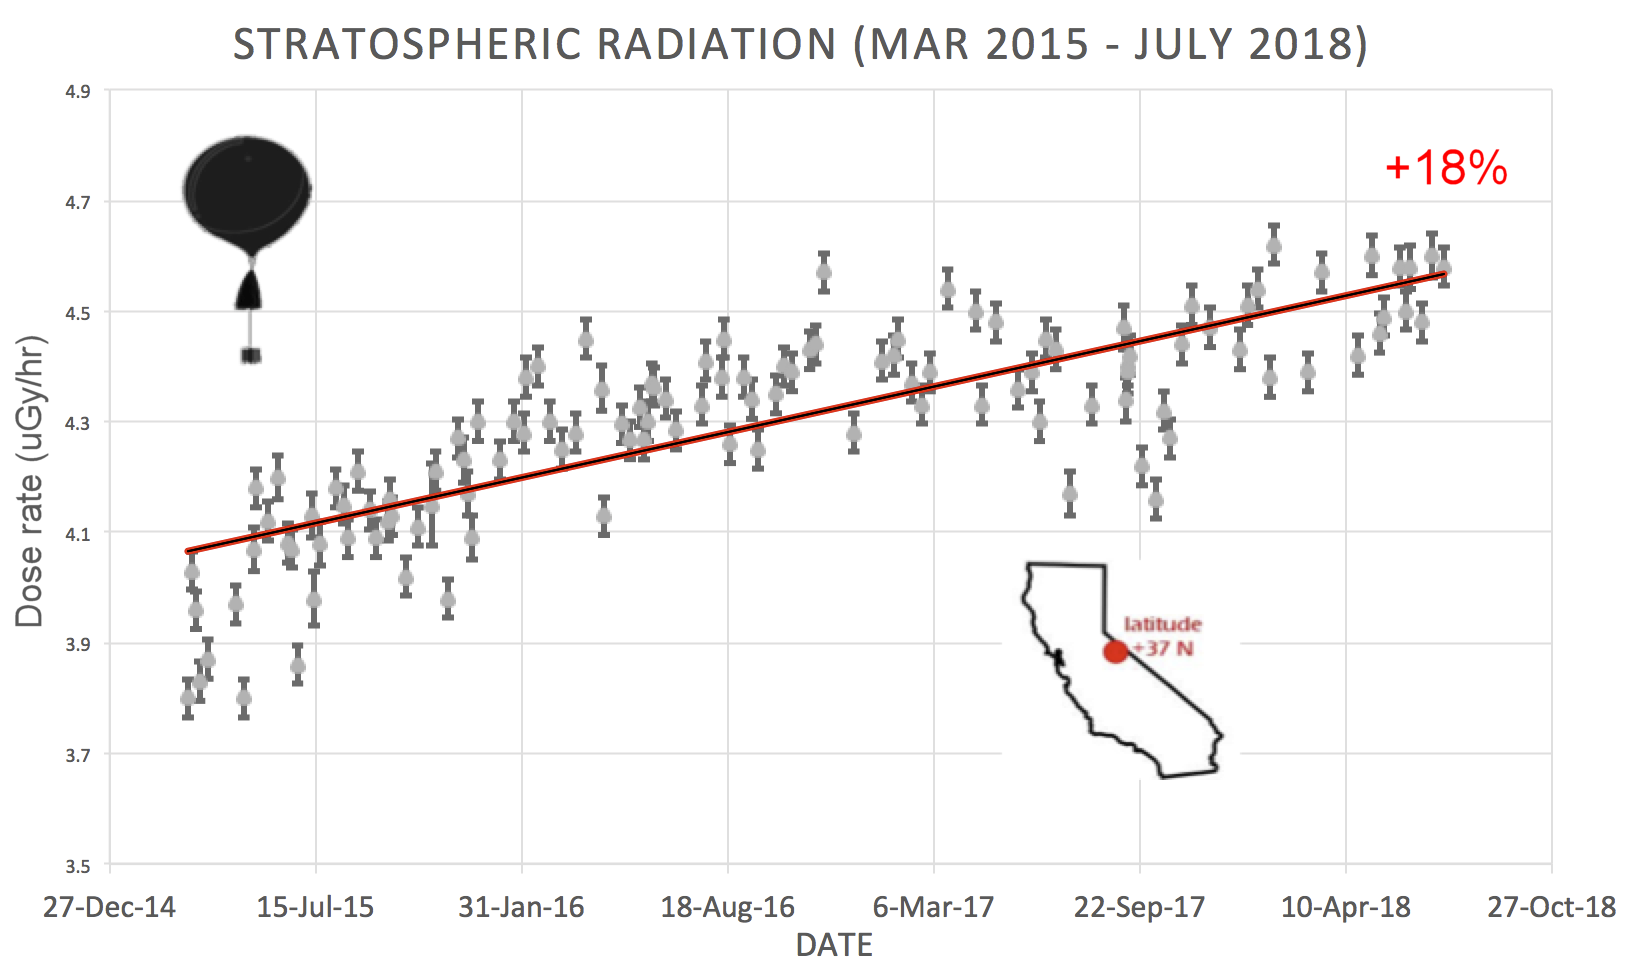
This plot displays radiation measurements not only in the stratosphere, but also at aviation altitudes. Dose rates are expessed as multiples of sea level. For instance, we see that boarding a plane that flies at 25,000 feet exposes passengers to dose rates ~10x higher than sea level. At 40,000 feet, the multiplier is closer to 50x. These measurements are made by our usual cosmic ray payload as it passes through aviation altitudes en route to the stratosphere over California. What is this all about? Approximately once a week, Spaceweather.com and the students of Earth to Sky Calculus fly space weather balloons to the stratosphere over California. These balloons are equipped with radiation sensors that detect cosmic rays, a surprisingly "down to Earth" form of space weather. Cosmic rays can seed clouds, trigger lightning, and penetrate commercial airplanes. Furthermore, there are studies ( #1, #2, #3, #4) linking cosmic rays with cardiac arrhythmias and sudden cardiac death in the general population. Our latest measurements show that cosmic rays are intensifying, with an increase of more than 13% since 2015: 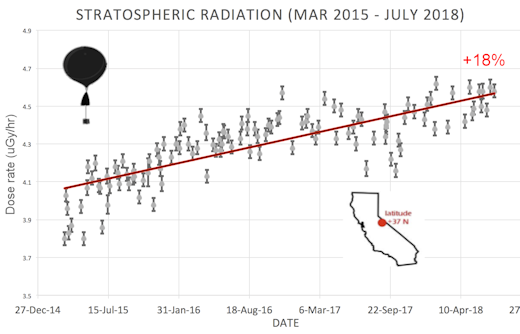
Why are cosmic rays intensifying? The main reason is the sun. Solar storm clouds such as coronal mass ejections (CMEs) sweep aside cosmic rays when they pass by Earth. During Solar Maximum, CMEs are abundant and cosmic rays are held at bay. Now, however, the solar cycle is swinging toward Solar Minimum, allowing cosmic rays to return. Another reason could be the weakening of Earth's magnetic field, which helps protect us from deep-space radiation. The radiation sensors onboard our helium balloons detect X-rays and gamma-rays in the energy range 10 keV to 20 MeV. These energies span the range of medical X-ray machines and airport security scanners. The data points in the graph above correspond to the peak of the Reneger-Pfotzer maximum, which lies about 67,000 feet above central California. When cosmic rays crash into Earth's atmosphere, they produce a spray of secondary particles that is most intense at the entrance to the stratosphere. Physicists Eric Reneger and Georg Pfotzer discovered the maximum using balloons in the 1930s and it is what we are measuring today. | | The official U.S. government space weather bureau | | | The first place to look for information about sundogs, pillars, rainbows and related phenomena. | | | Researchers call it a "Hubble for the sun." SDO is the most advanced solar observatory ever. | | | 3D views of the sun from NASA's Solar and Terrestrial Relations Observatory | | | Realtime and archival images of the Sun from SOHO. | | | from the NOAA Space Environment Center | | | fun to read, but should be taken with a grain of salt! Forecasts looking ahead more than a few days are often wrong. | | | from the NOAA Space Environment Center | | | the underlying science of space weather |  | If you are a Youtuber and want to buy real Youtube views than try out Buyrealsocial.com for the best results possible! | | To find reviews of new online casino sites in the UK try The Casino DB where there are hundreds of online casino reviews complete with bonuses and ratings. | | | These links help Spaceweather.com stay online. Thank you to our supporters! | | | | | | | | |  | | |  | ©2017 Spaceweather.com. All rights reserved. This site is penned daily by Dr. Tony Phillips. | |


